Table of Contents
This chapter describes the key features of ADMIN.
ADMIN manages various SysMaster settings and consists of management functions for agents, business systems, events, permissions, menus, custom dashboards, and resources. An account with administrative authority must be used to log in to ADMIN.
The following is the ADMIN home screen.
The home screen can be accessed by clicking on the ADMIN logo or the
home button (![]() ) on the top of the screen. Log Out(
) on the top of the screen. Log Out(![]() ), Help(
), Help(![]() ), Back to Monitoring Page(
), Back to Monitoring Page(![]() ) buttons are on the top right of the
screen.
) buttons are on the top right of the
screen.
Note
The Help section is currently under development.
[SysMaster] section is used to configure the basic monitoring environment. It consists of the [Resource], [Business System], and [Statistics] sub menus.
Resource section provides functions to add, delete, or modify properties of the Agent and its child components, resources, nodes, and containers.
The following are the common functionalities.
-
If a node is selected from the left tree menu, the node name will turn light blue and the related information will be displayed on the right where you can edit certain settings.
-
The grayed out fields on the right cannot be modified.
-
Required field name is followed by an asterisk(*).
-
Korean language and special characters cannot be used except in the Description and Message fields.
-
If you right-click on the selected node, a context menu will appear. The context menu provides functions that can be used at the selected node level. 'Add' and 'Delete' actions can be performed at the leaf nodes.
-
The color of the node icon can be used to check its status. A colored icon indicates that the status is 'Ready', and a gray icon indicates that the status is 'Not Ready'.
Resource List
The following is a description of the icons on the top left of the tree that displays the list of the resources.
-
Filters
Click on a resource icon to only display the resources of the selected resource type in the tree.
Icon Description [J] Was [S] Sysmon [O] Oracle [T] Tibero [TM] Tmax -
Buttons
Menu Description 
Expands the entire tree. 
Collapses the tree to the Agent level. 
Refreshes the tree. -
Search
Enter text in the search textbox to highlight all nodes containing the search text in orange. The search text is not case-sensitive.
Adding an Agent
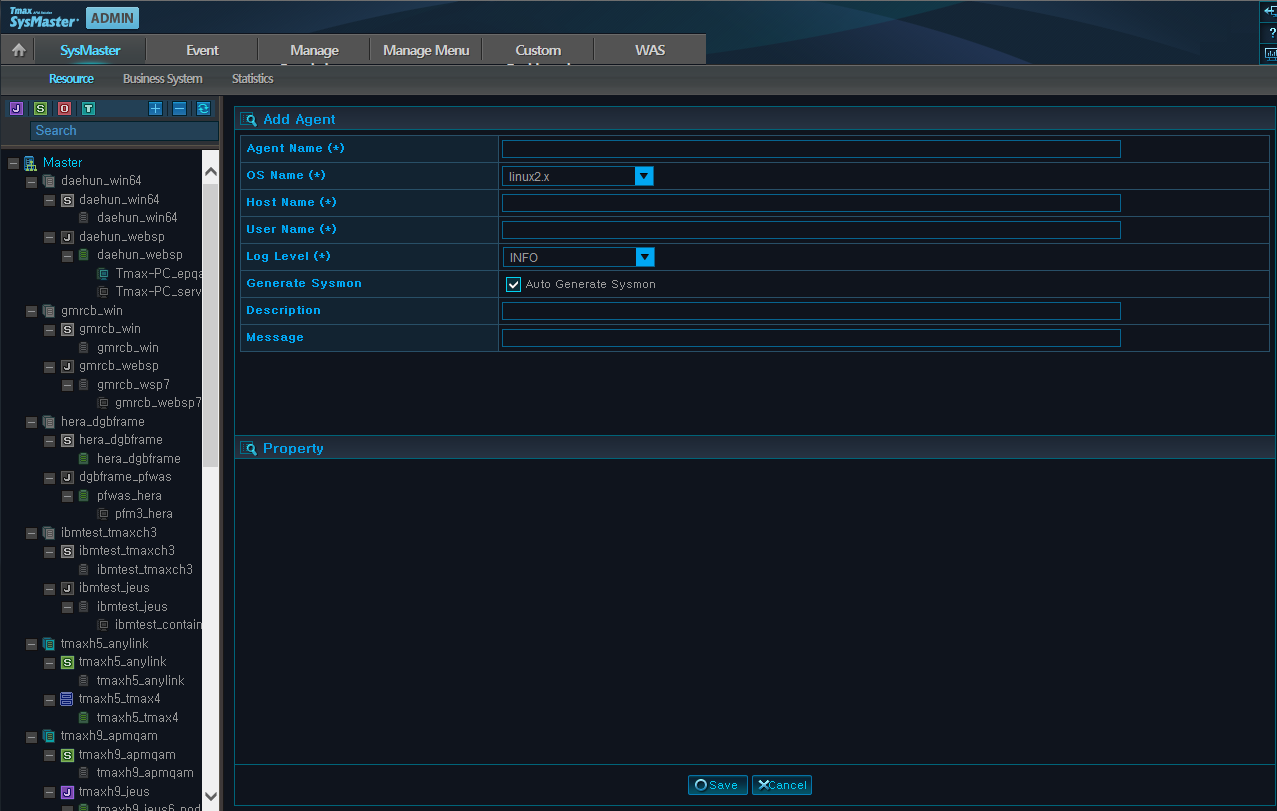
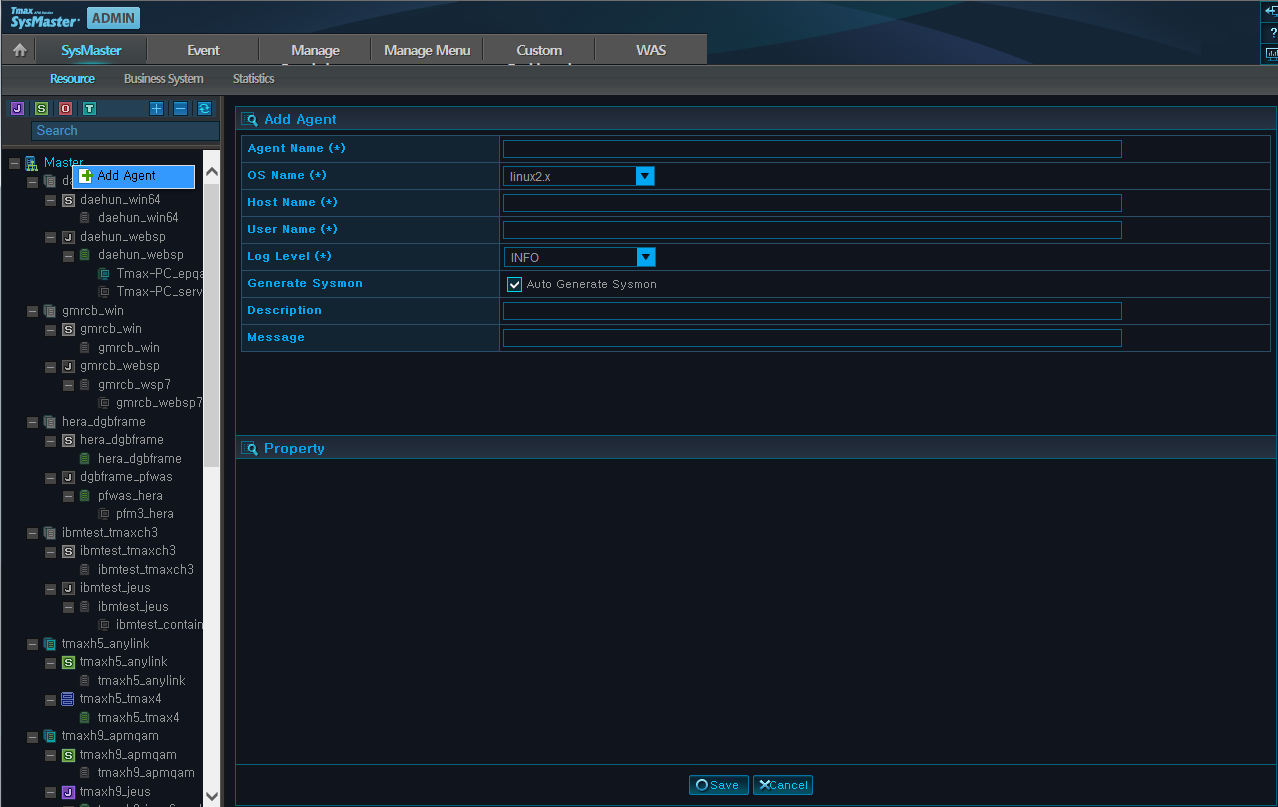
This is the SysMaster home screen in ADMIN. Click on the root node of the tree, Master, and right-click to see the [Add Agent]menu. When this menu is clicked, a screen for adding an Agent will appear on the right. Fill in the necessary fields and then click [Save]. The newly added Agent will appear in the tree.
The following is description of the properties.
| Property | Description |
|---|---|
| Agent Name (*) | User-defined Agent name. For manageability, use the name of the host machine where the Agent is installed and the resource type. |
| OS Name (*) | Select the OS type and bit number of the Agent machine. |
| Host Name (*) | Host name of the Agent machine. |
| User Name (*) | Login Name of the OS account used to install the Agent. |
| Log Level (*) | Log level of the Agent. |
| Generate Sysmon | Select whether to add Sysmon provider when adding an Agent. Sysmon collects the system performance data. Enabled by default. |
| Description | Enter additional information about the Agent. |
| Message | Enter any messages about the Agent. |
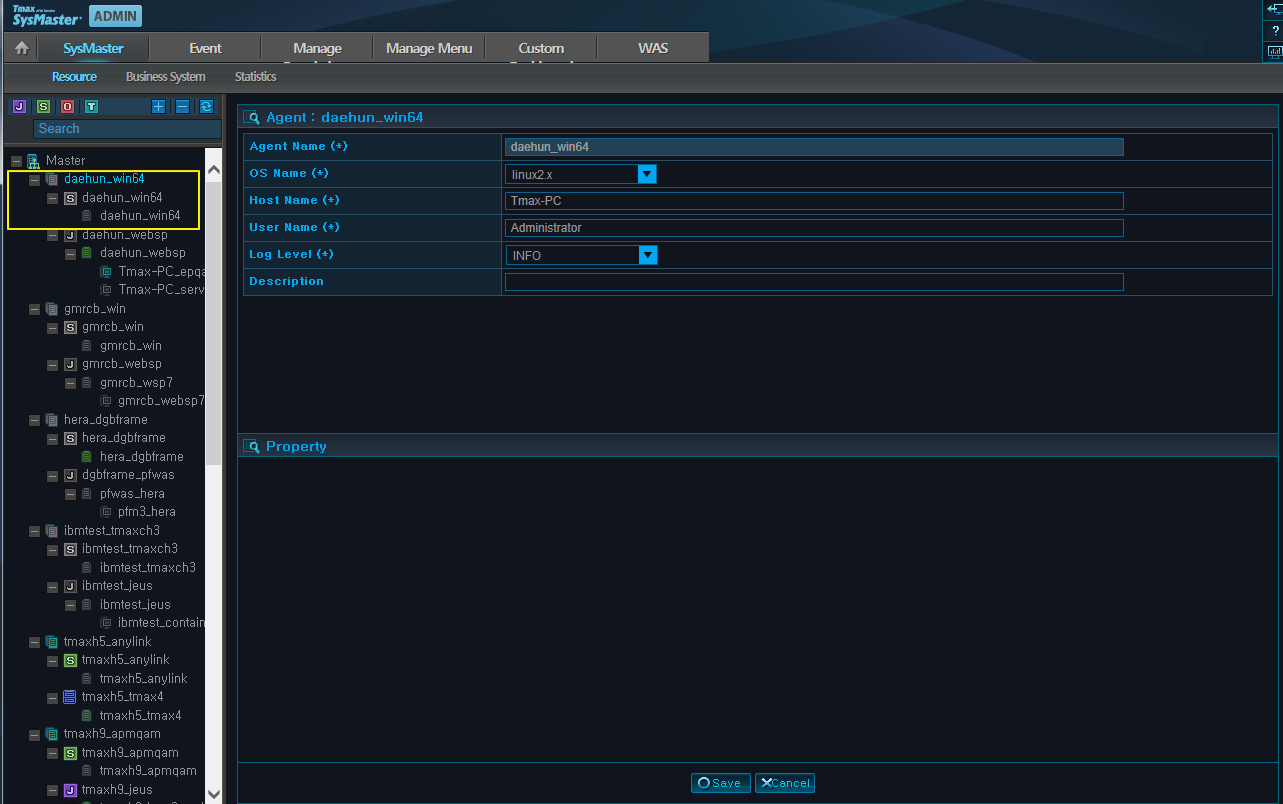
The following shows the result of adding an Agent named 'daehun_win64' by generating Sysmon provider. Sysmon provider and Node are displayed below the Agent. When you click on the Agent, its information appears on the right.
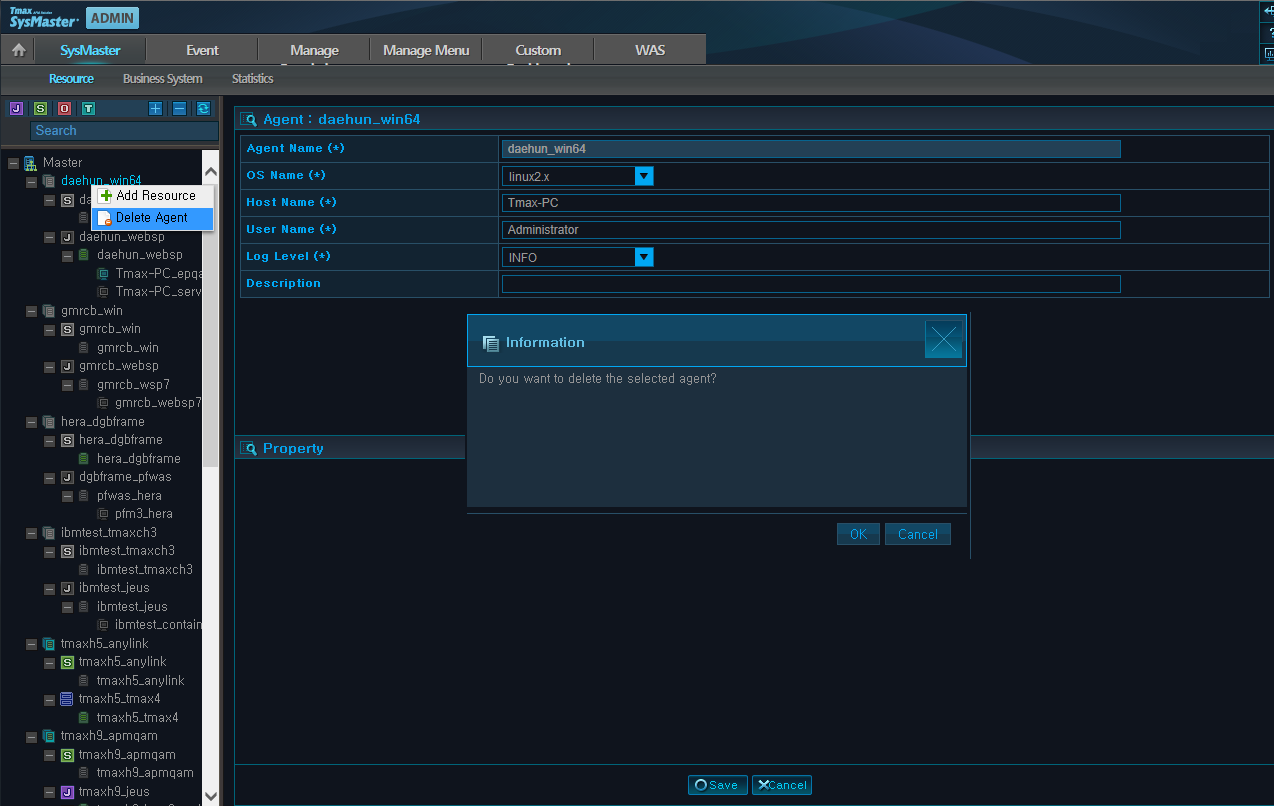
Deleting an Agent
Select the Agent to delete and right-click on it to see the [Delete Agent] menu. When the menu is clicked, a delete confirmation popup window will appear. Click [OK] to delete the Agent. Use the same method to delete any sub nodes of the tree.
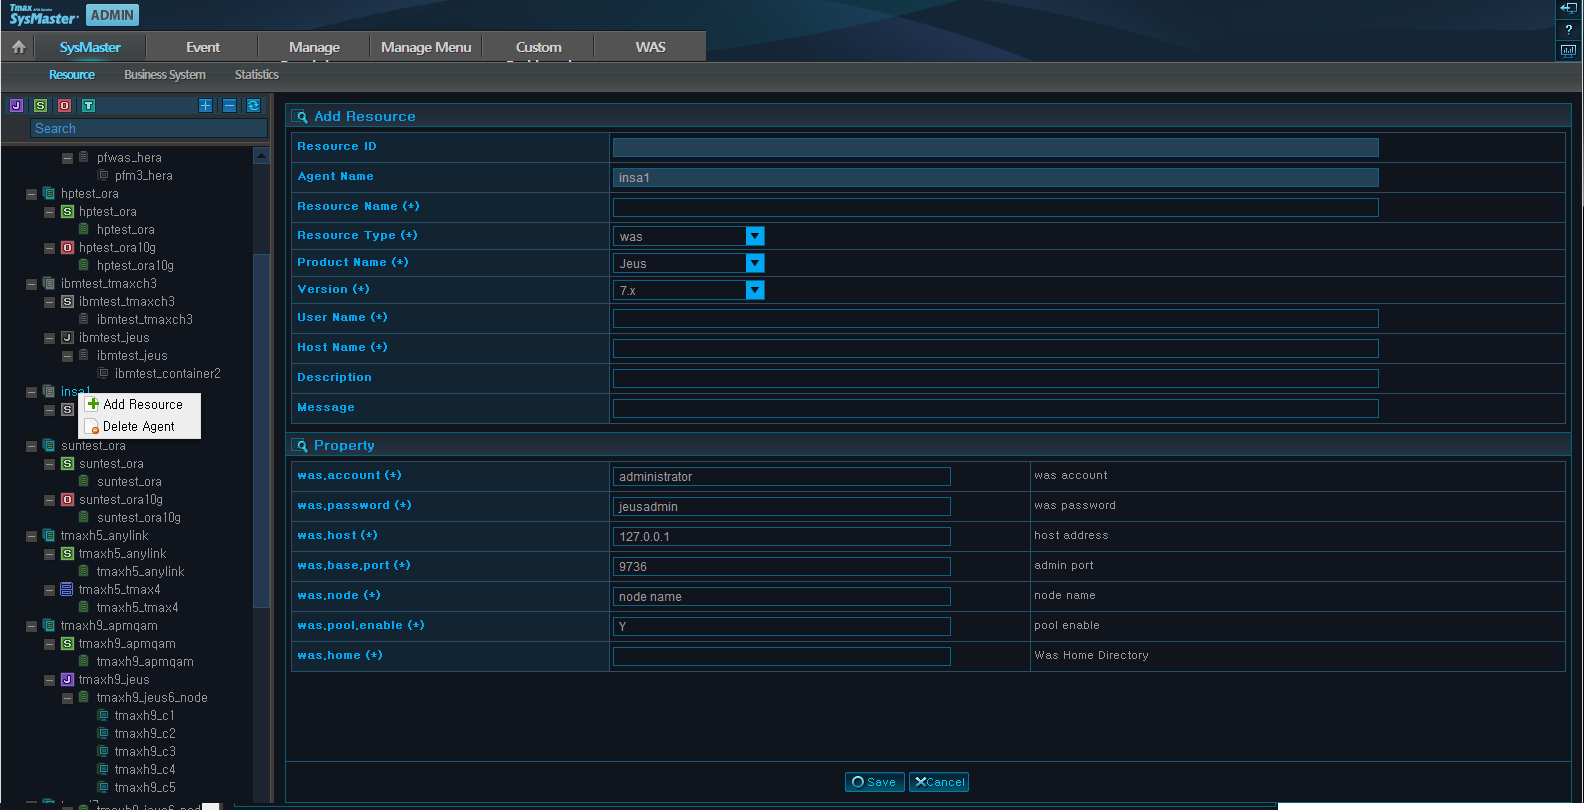
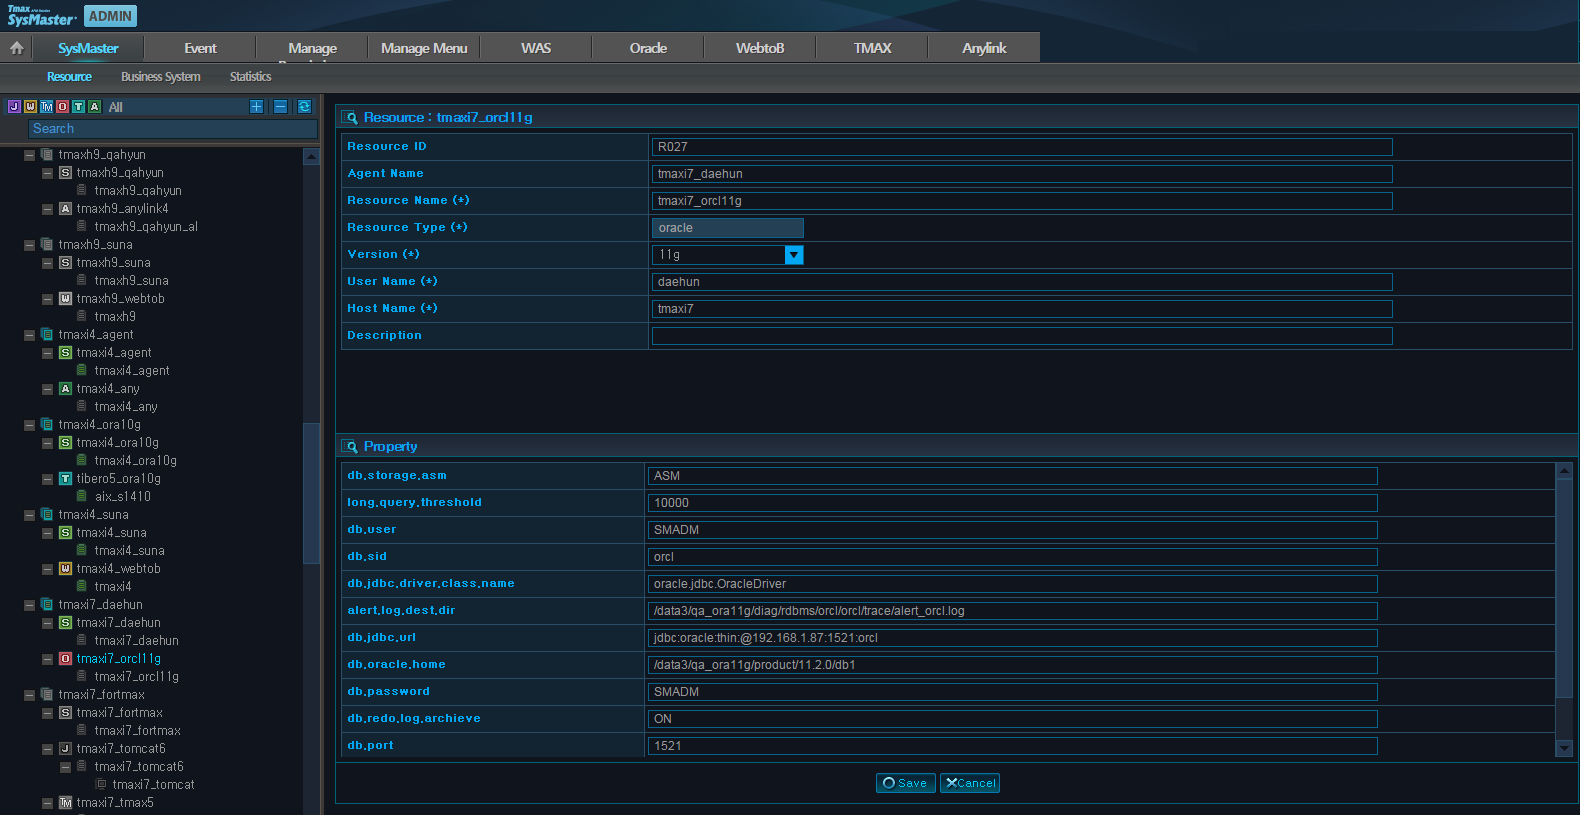
Adding a Resource
Select the Agent and right-click on it to see the [Add Resource] menu. When the menu is clicked, a screen for adding a Resource will appear on the right. The input fields will change according to the resource type.
The following is description of the properties.
| Property | Description |
|---|---|
| Resource ID | Automatically assigned serial number of the form RXXX. Cannot be modified by the user. |
| Agent Name | Name of the Agent selected (Automatically filled) |
| Resource Name (*) | Resource name. For manageability, use resource type and node name. |
| Resource Type (*) | Select the Resource type. (sysmon, was, etc.) |
| Version (*) | Resource version. |
| User Name (*) | Login Name of the OS account used to install the Resource. |
| Host Name (*) | Host name of the machine where resource is installed. |
| Product Name (*) | Used when Resource Type is WAS. Select the WAS product name. (Jeus, Oracle AS, WebLogic) |
| Description | Enter additional information about the Resource. |
| Message | Enter any messages about the Resource. |
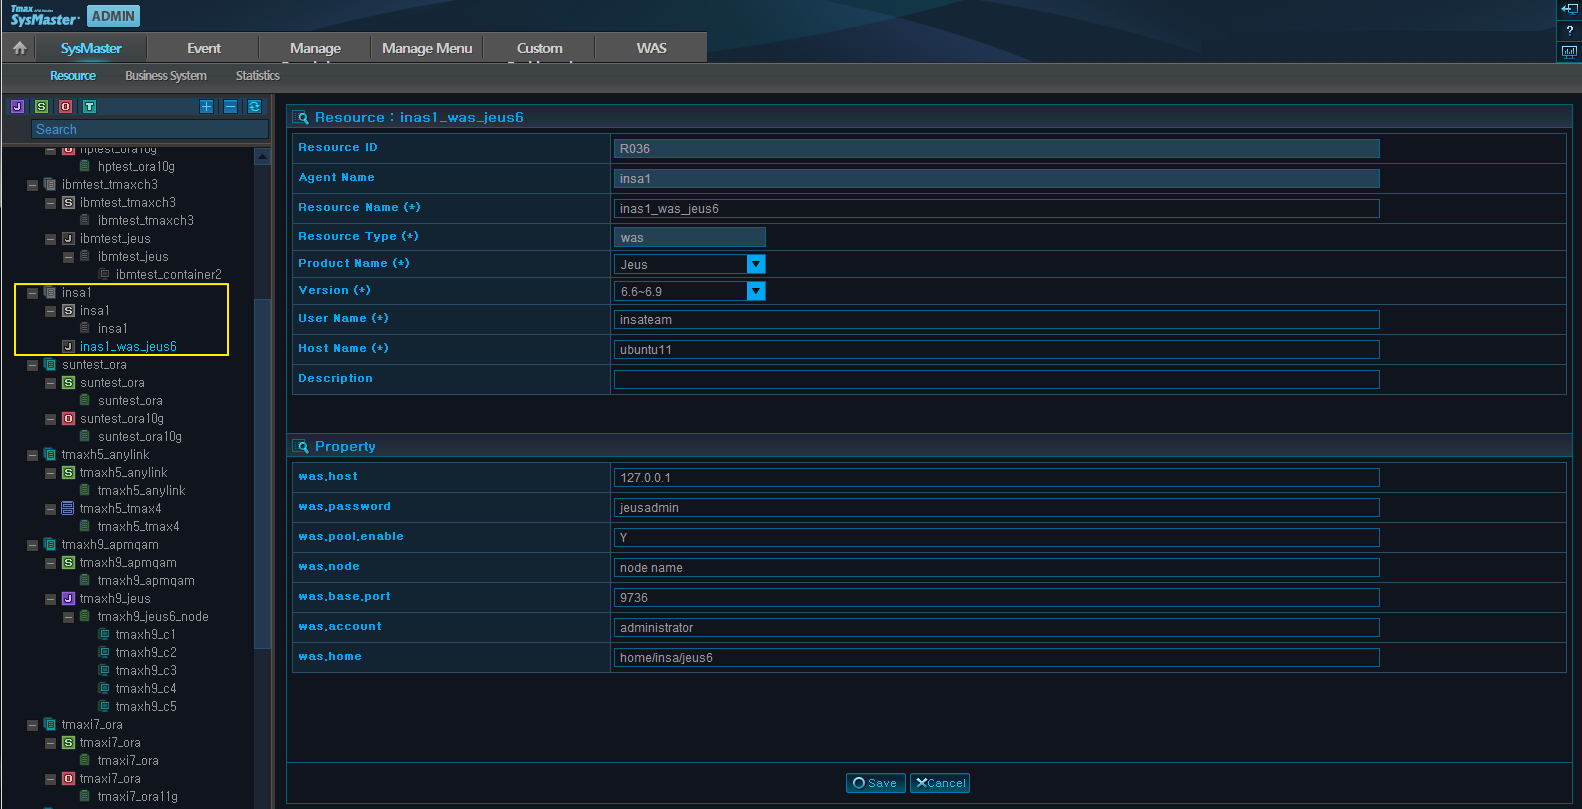
The following screen shows that the WAS provider, 'inas1_was_jeus', has been added to the 'insa1' Agent.
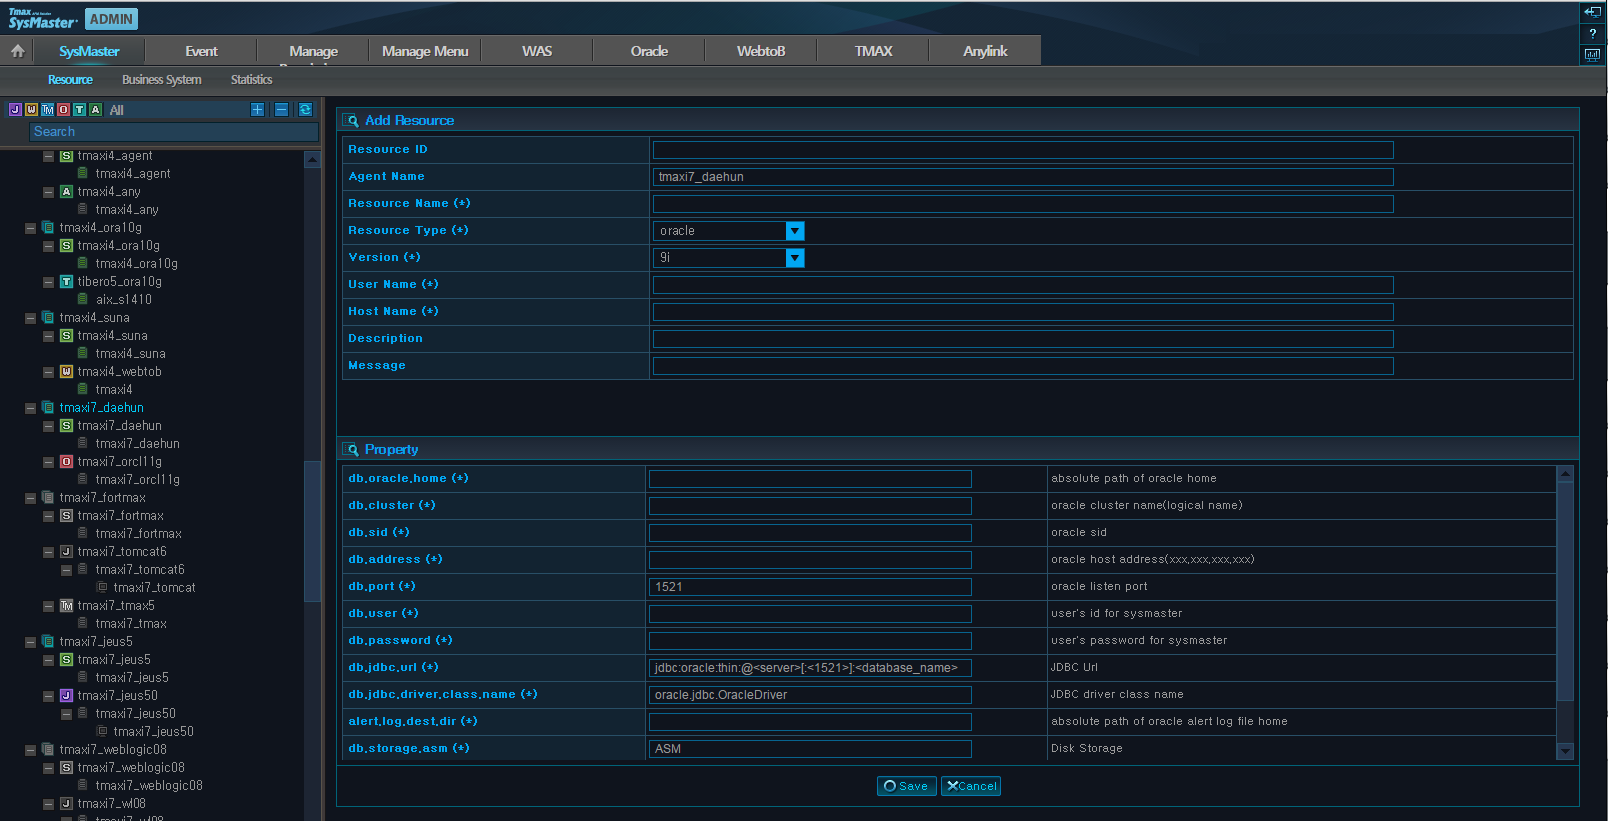
The following screen shows that the Oracle provider, 'daehun_sub_oracle', has been added to the 'daehun_sub' Agent.
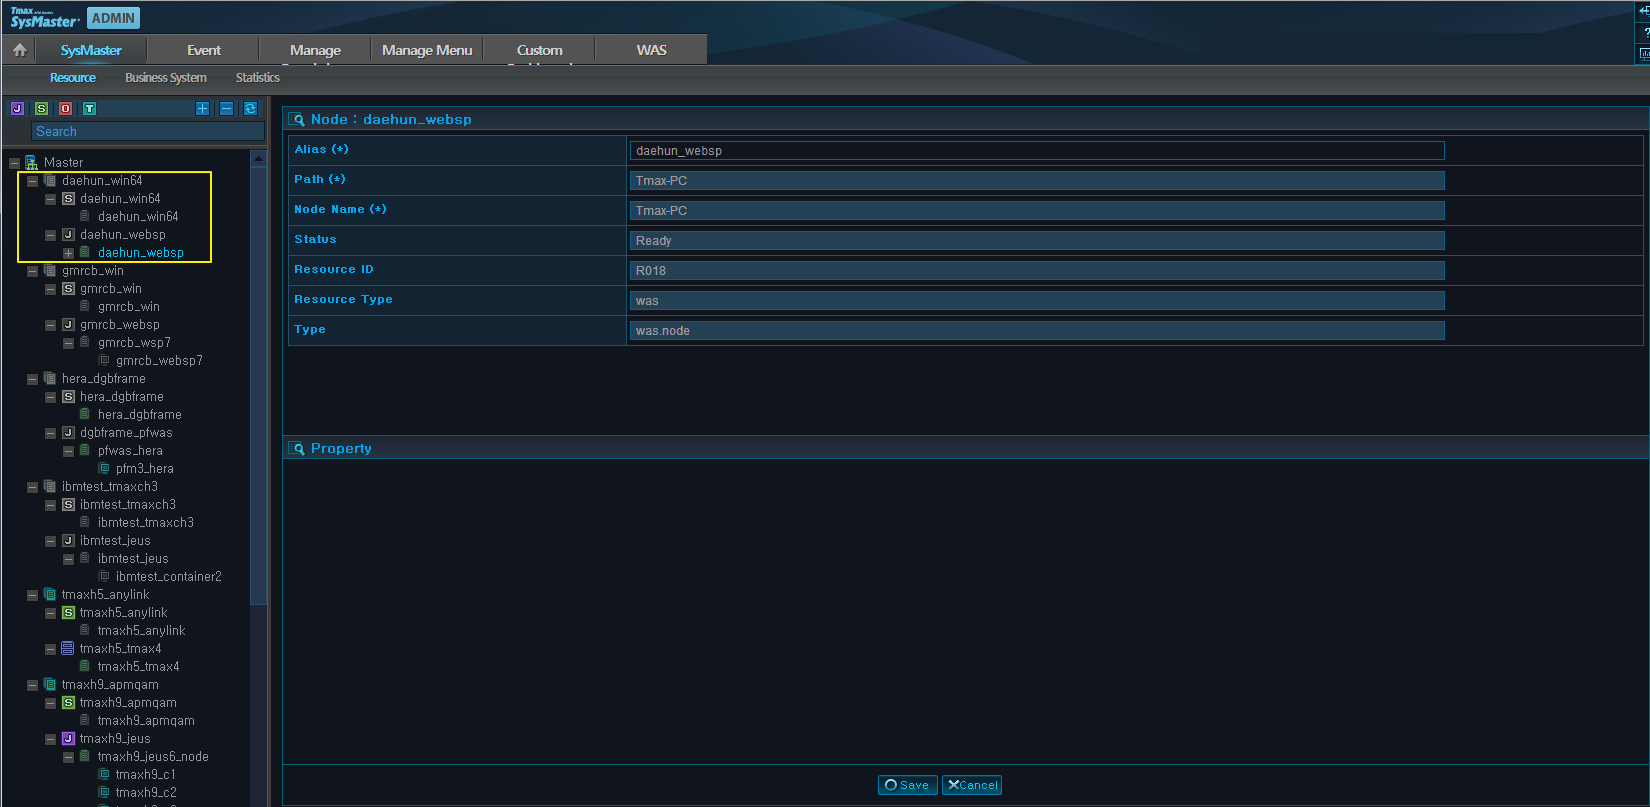
Adding a Node
The following shows a WAS node added to the resource using the aforementioned method. The node must be added before adding any leaf nodes (e.g., Container) to monitor.
The following is description of the properties.
| Property | Description |
|---|---|
| Alias (*) | Node name displayed on the monitoring screen. |
| Path (*) | Used as the only unique ID of the registered node. Once registered, it cannot be modified. |
| Node Name (*) | Name of the registered node. In general, use the hostname of the machine where the node is installed. |
| Status | Node status. |
| Resource ID | ID of the parent resource. (Automatically filled) |
| Resource Type | Provider type of the parent resource. (Automatically filled) |
| Type | Node type. (Automatically filled) |
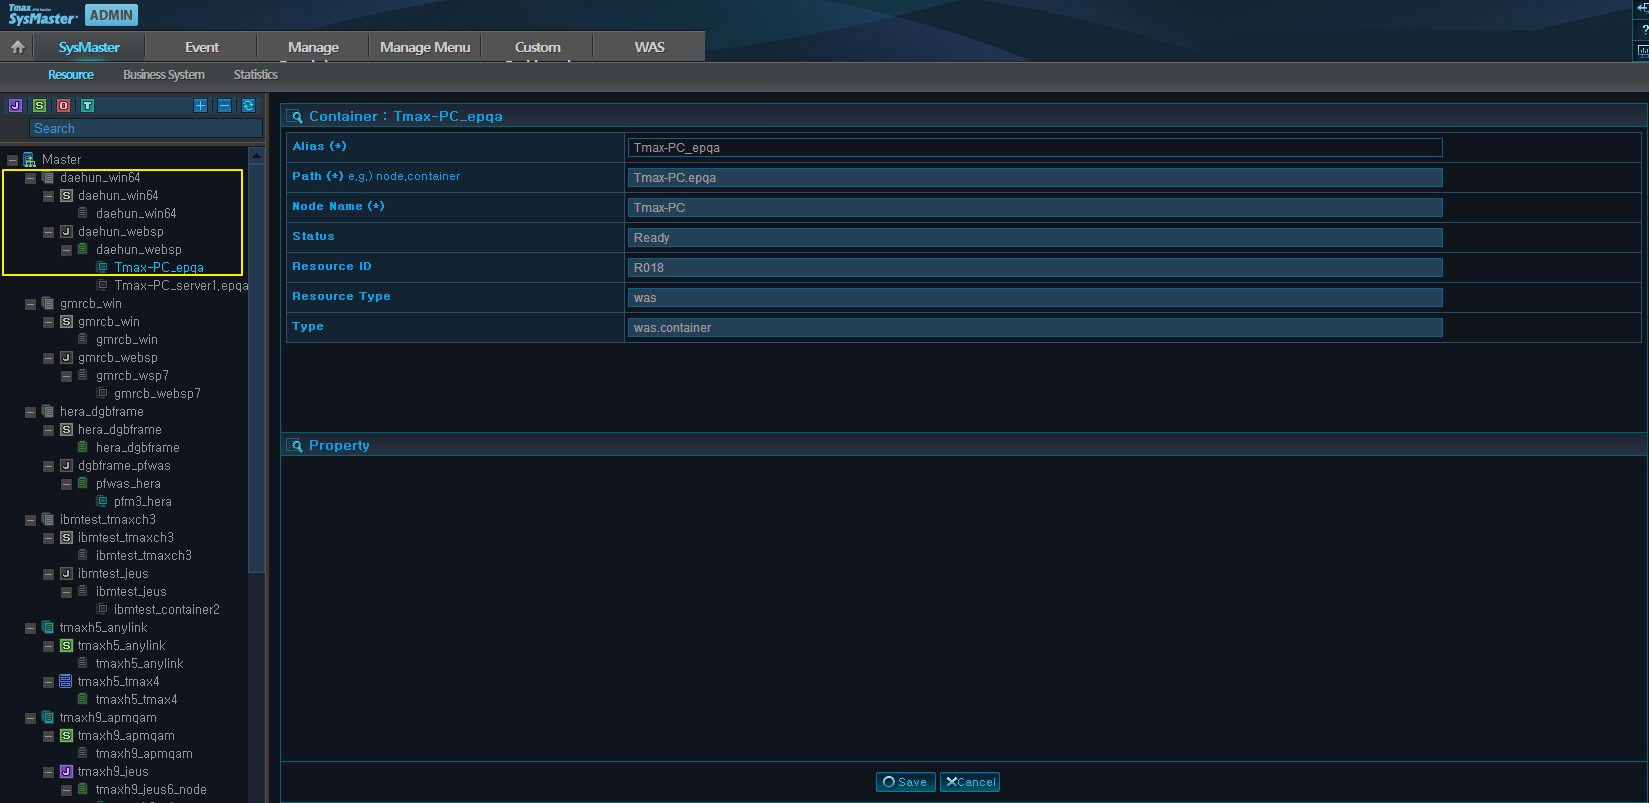
Adding a Container
The following is an example of a WAS Container that was added to a Node.
The following is description of the properties.
| Property | Description |
|---|---|
| Alias (*) | Container name displayed on the monitoring screen. |
| Path (*) | Used as the only unique ID of the registered container. Once registered, it cannot be modified.. |
| Node Name (*) | Name of the parent node. (Automatically filled) |
| Status | Container status. |
| Resource ID | ID of the Parent resource. (Automatically filled) |
| Resource Type | Provider type of the parent resource. (Automatically filled) |
| Type | Container type. (Automatically filled) |
Business system is a business structure that shows the type of tasks the node registered to the resource is responsible for.
Configuring the business system is the main task of SysMaster. On all the dashboards, the nodes and containers are shown with business system configurations and business system-specific service statistics are displayed. Each system is configured according to its business characteristics, and intuitive monitoring is provided by assigning a node to each system.
The tree on the left shows the existing business systems, and to the right of the tree are the assigned and unassigned lists of nodes for the selected business system. If text is entered in the search textbox, all nodes containing the search text will be highlighted in orange. Both business and node names can be searched.
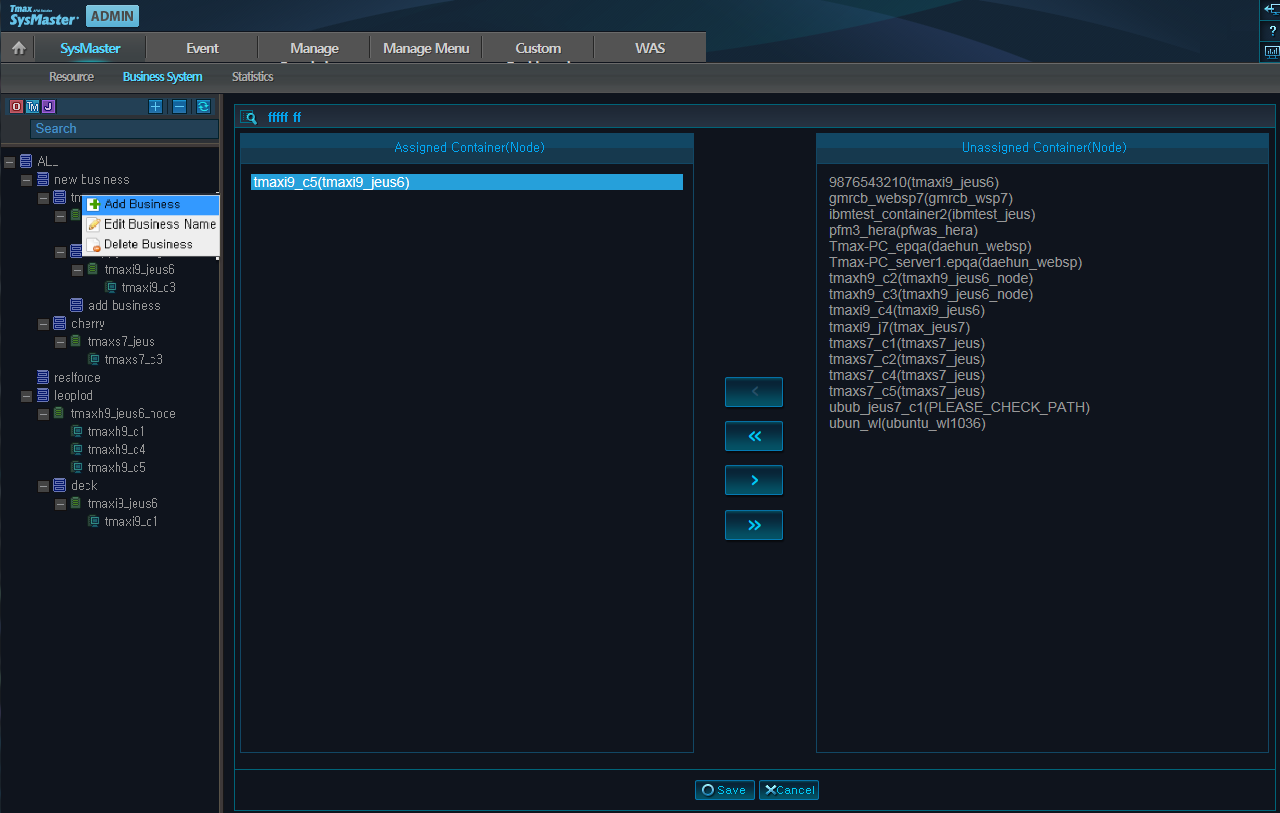
The following is an example of the business system screen.
Managing Business Systems
Business system can be managed using the tree on the left. Only business names can be selected from the tree; nodes cannot be selected. Select and right-click on the business name and a management context menu (add, edit, delete) will appear.
The following describes the business system menu items.
| Menu | Description |
|---|---|
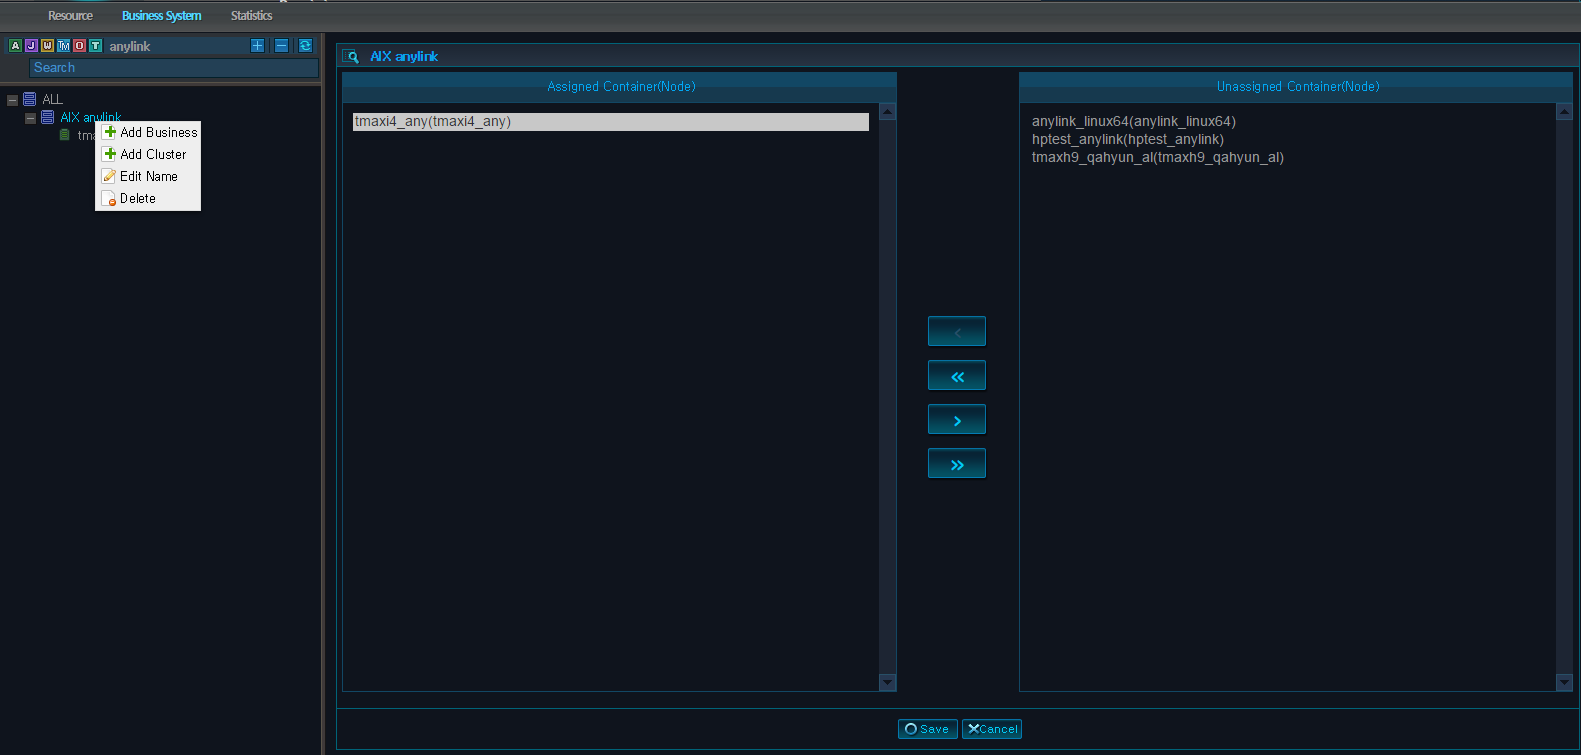
| [Add Business] | Add a new sub business below the selected business. |
| [Add Cluster] | This menu is only visible when the selected resource is either Oracle or Tibero. A cluster can be added to a business, but a business or a cluster cannot be added to a cluster. |
| [Edit Business Name] | Edit the name of the selected business. |
| [Delete Business] | Delete the selected business. All the sub nodes of the deleted business become unassigned nodes. Businesses can also be moved within the tree using the Drag&Drop method. |
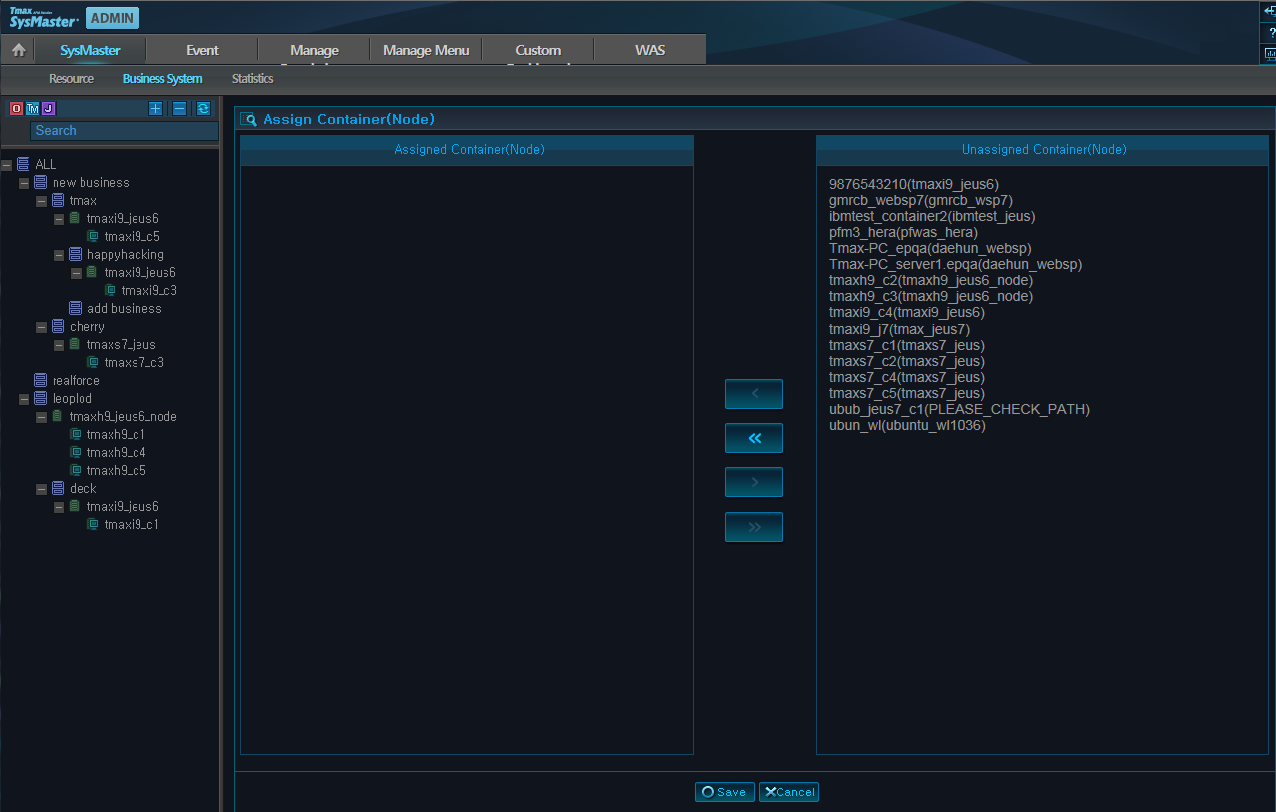
Assigning Containers
If a business name is selected from the left tree menu, the name will turn light blue and the assigned nodes will appear in the 'Assigned Container' list. The nodes that are not assigned to any businesses will appear in the 'Unassigned Container' list. The unassigned nodes will appear at the very bottom of the tree outside the business area of the dashboard.
The following shows assigning a node called 'insa1' to a newly added business called 'insa1'.
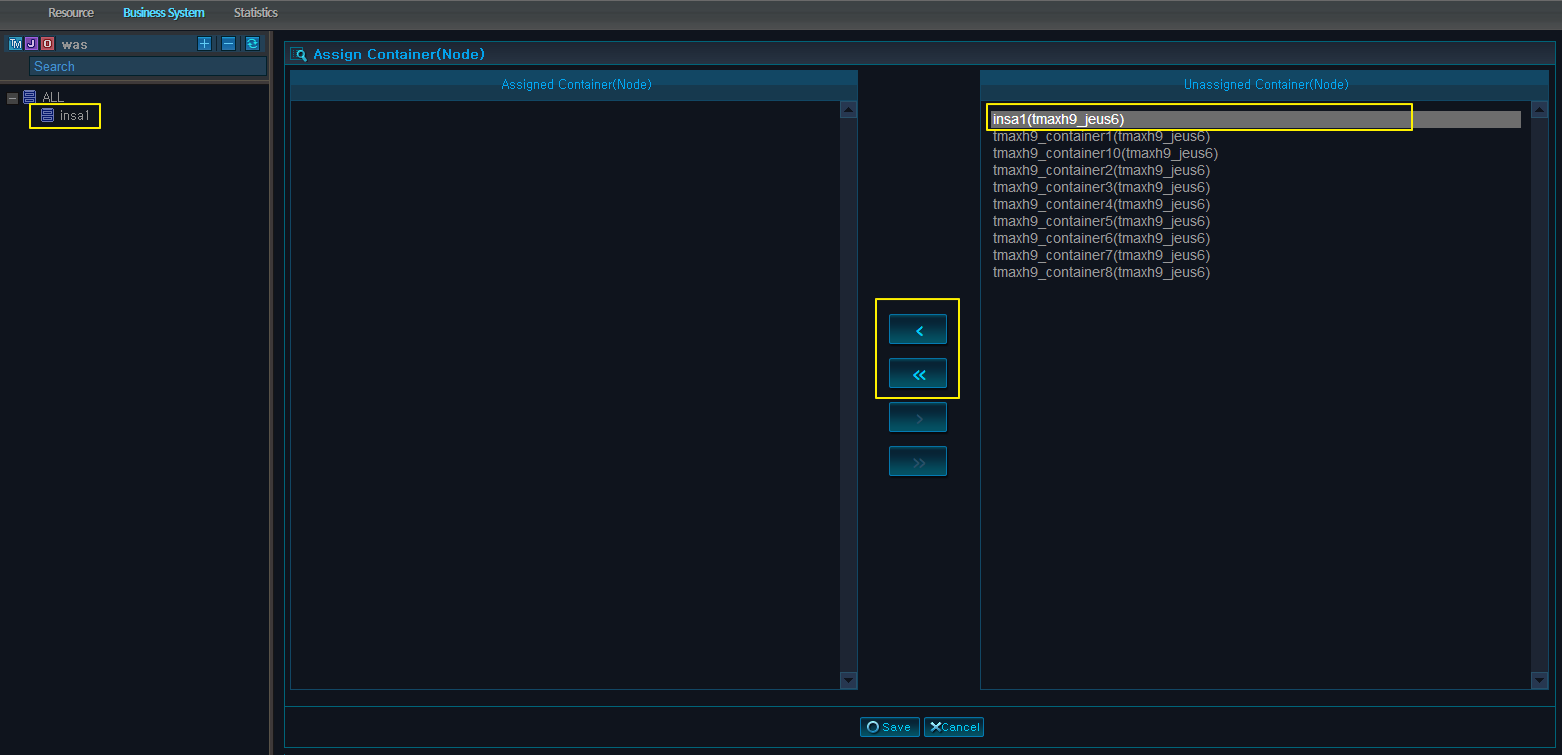
If an unassigned node is selected from the list on the right, usable arrow buttons will be highlighted. Use these buttons ([<], [<<]) to move the selected node to the 'Assigned Container' list. Click on the [Save] at the bottom to complete the node assignment. Use the reverse arrow buttons to remove the node assignment.
The statistics screen can be used to set the save cycle of provider-specific statistical data. Statistical data consists of category and DB table pairs that are matched hourly. Category refers to the type of statistical data collected by the resource.
The initial screen shows the resource list. The list changes according to the type of resource installed on the Master. When a resource is selected, the category list related to the resource appears on the right. If a category is selected, save cycle setting form for the related data will appear on the bottom.
For example, select the Sysmon CPU statistical data category to change its 'Daily Data' save cycle as shown below.
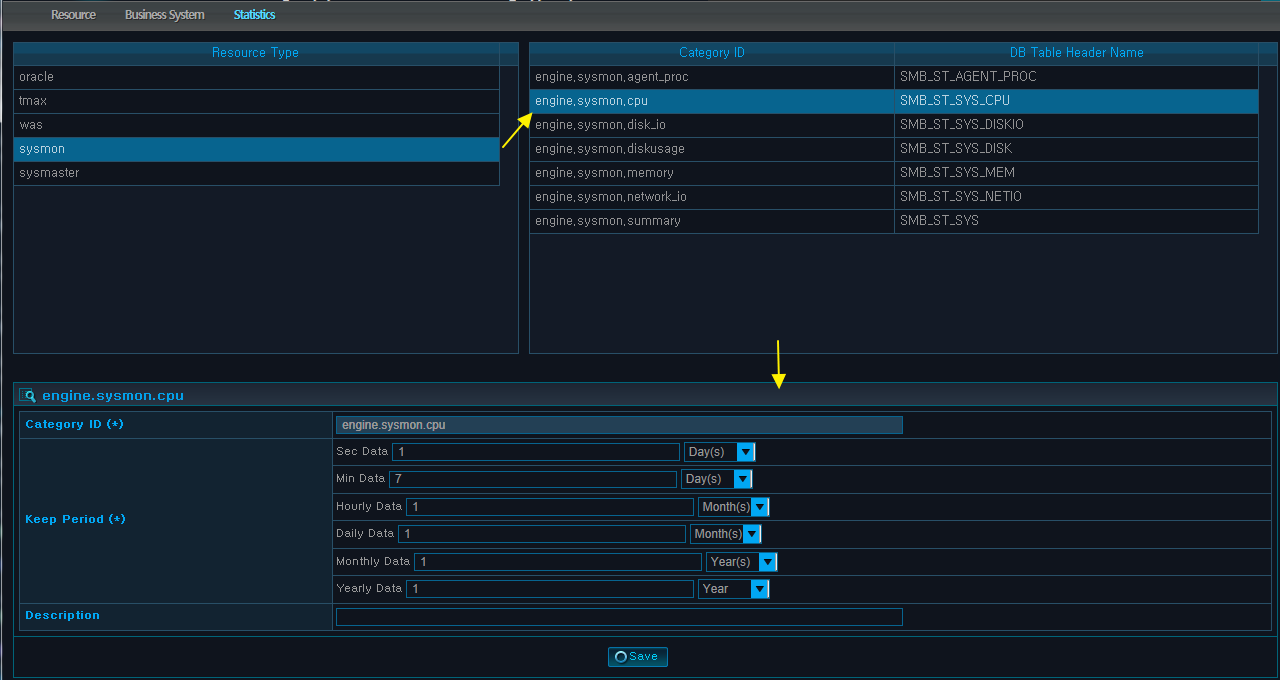
The following describes each field. (* : Required input field)
| Field | Description |
|---|---|
| Category ID (*) | Displays the category name selected on the top screen. Indicates the data type. |
| Keep Period | Sets keep period for data per sec., min., hr., month, and year. |
| Description | Category description (user input). |
In the Event section, customized events can be created by selecting monitoring factors besides the basic events provided by SysMaster. Event trigger conditions can be adjusted for each event and config path.
The following is description of the sub menu items of [Event].
| Menu | Description |
|---|---|
| [Search Threshold] | Lookup a list of currently possible events and their conditions. |
| [Threshold Settings] | Change the event trigger conditions. |
| [Search Event] | Lookup currently defined event types. |
| [Event Settings] | Define a new event. |
For an event to be triggered, the event must be defined as well as be registered in threshold setting for each config path. The basic events provided by SysMaster are automatically registered when the config path (node or container) is registered in [SysMaster] > [Resource]. After the user defines a new event, it must be registered in threshold setting for each config path to complete the registration.
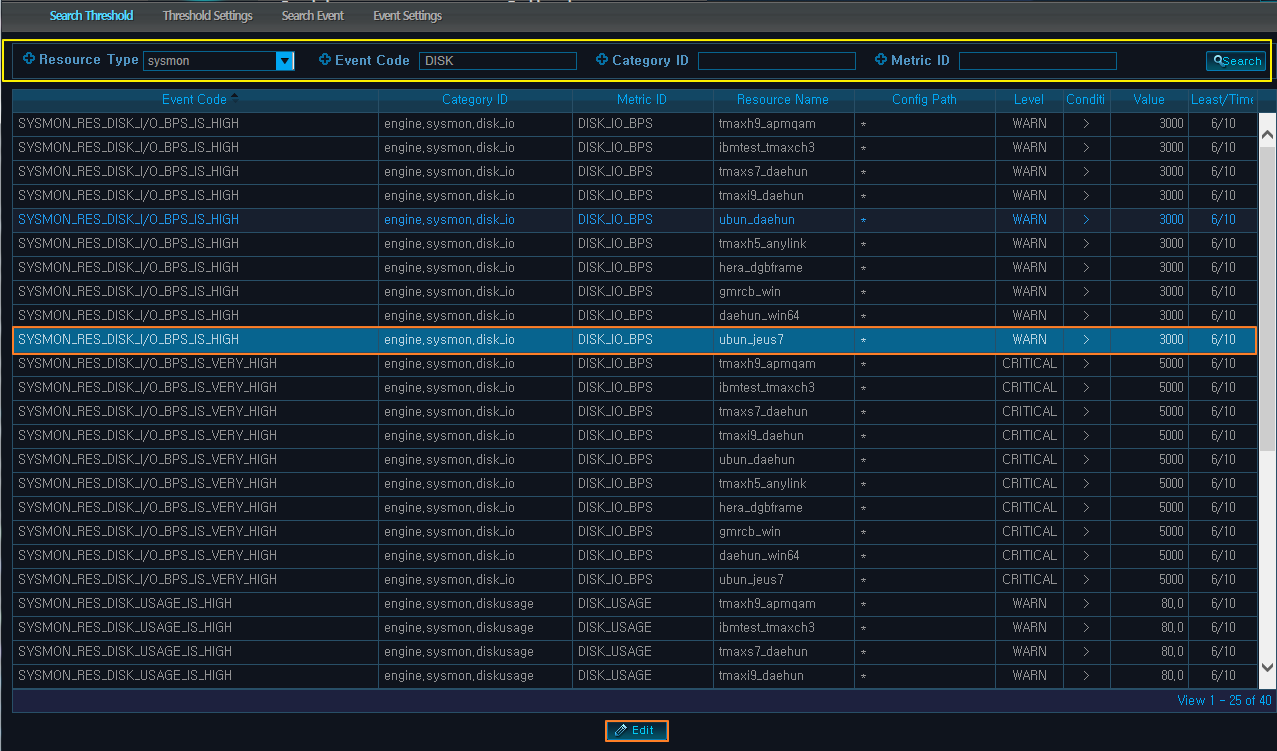
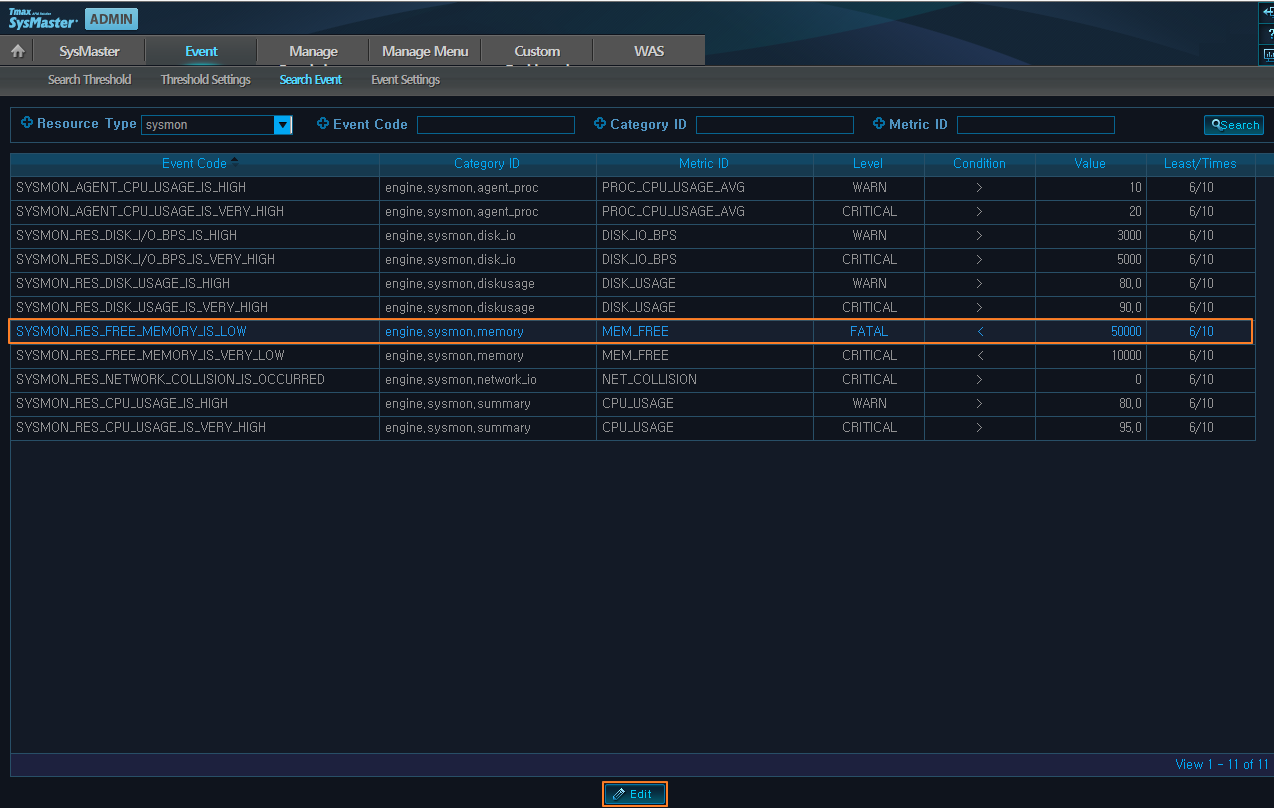
A list of currently possible events by event code and config path including their trigger conditions can be viewed. Search conditions including 'Resource Type', 'Event Code', 'Category ID', and 'Metric ID' are provided. Search text can include the "like" keyword.
The following screen shows the result of looking up the threshold settings using search conditions. To change the event trigger condition, select the setting and then click [Edit] at the bottom. The threshold configuration form for the selected event will appear.
The following is description of each properties that are commonly used throughout the ADMIN section.
| Property | Description |
|---|---|
| Event Code | Name and also ID of the event. It should express the resource type of the event and its meaning. |
| Category ID | Category ID that includes the event property. Category is data grouped by its characteristics. |
| Metric ID | Target of the event within the category. Event is triggered by setting a threshold value for Metric ID. |
| Resource Name | Resource name. Needed to register the event by config path. |
| Config Path | Name of config path. To include all sub config paths of a particular resource, use [*]. A config path is a monitoring unit registered for each resource. Sysmon = node, was = container, DB = instance. |
| Level | Event level. In the order of increasing level, there are [INFO,WARNING,CRITICAL,FATAL]. Refer to "Appendix D. Log4j Log Level" for information about each level. |
| Condition | Operators used to define an event condition are [<, >, <=, >=, ==, !=, Changed]. |
| Value | Reference value for Metric ID among event trigger conditions. |
| Min # of Exceeding THLD (Leasts) | Minimum number of occurrences that exceeded the threshold. |
| Lookup Count (Times) | Number of times event threshold was looked up. |
The following shows the threshold configuration screen.
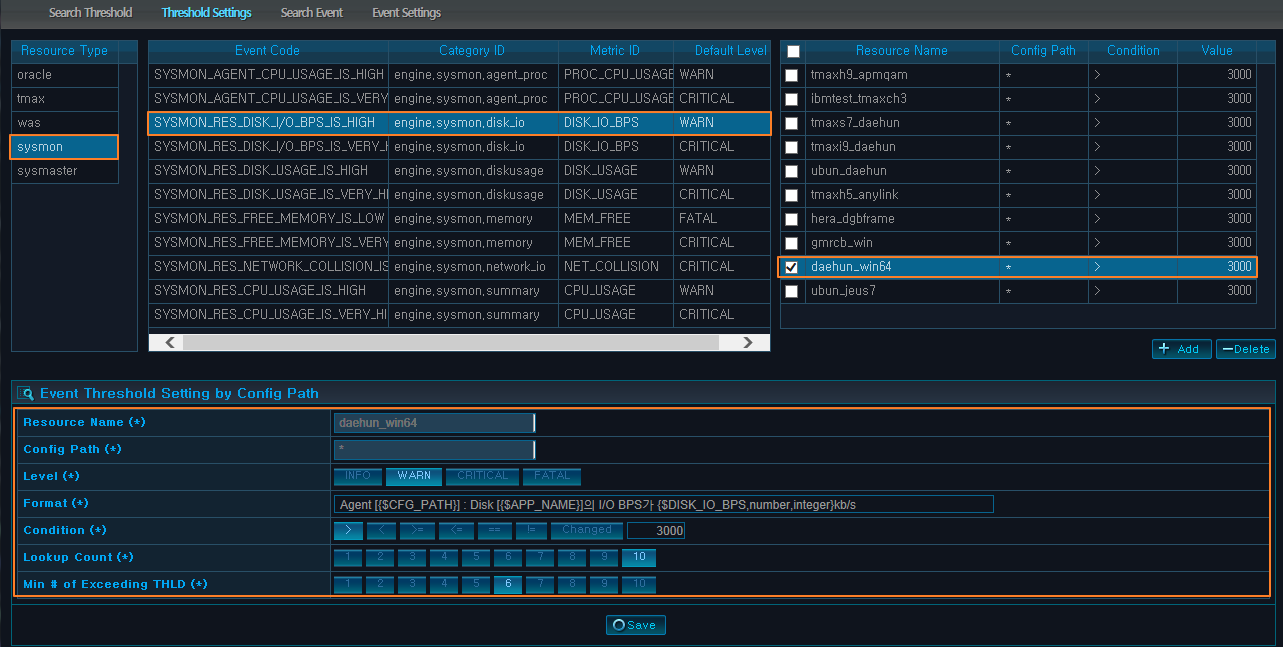
Even for the same event, the event conditions must be changed according to the server environment and service characteristics. SysMaster allows event settings to be changed for each config path(node or container) to enhance the accuracy of error detection. Threshold Settings screen is used to configure such settings. Threshold property descriptions are the same as those for the Search Threshold screen.
Modifying Threshold Settings
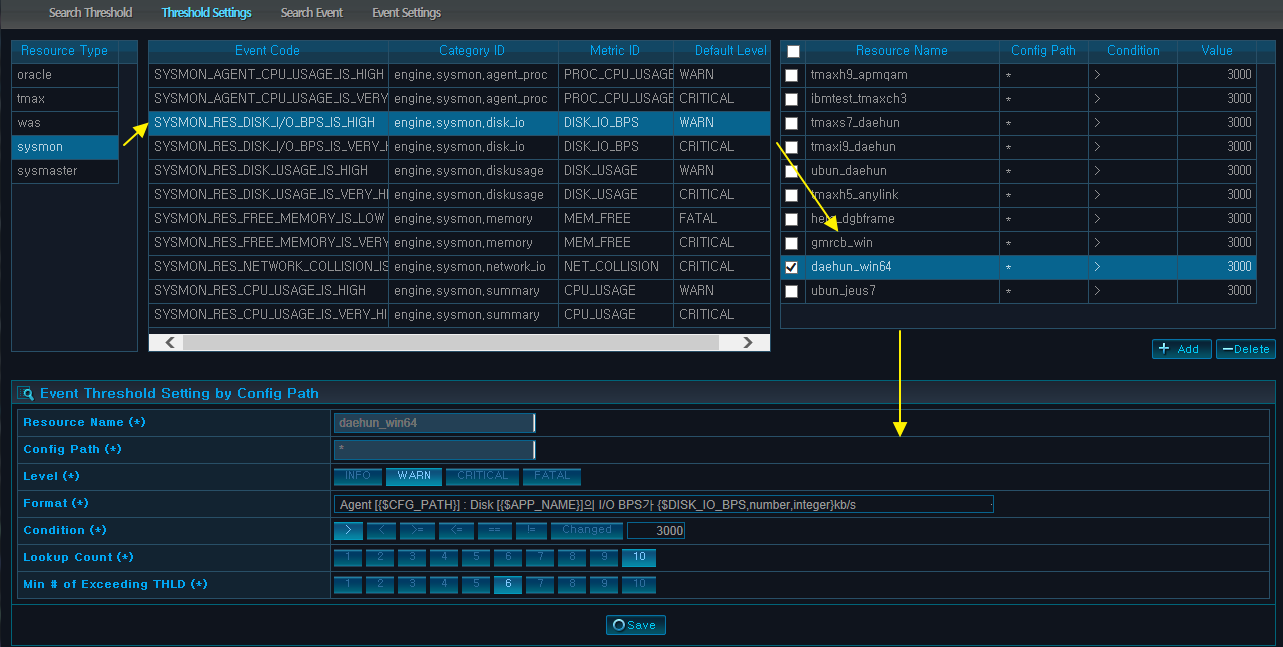
The initial Threshold Settings screen only shows a table of resource types. When a resource type is selected, an event code list appears. When an event code is selected from the list, the registered event's config path list appears. When a config path is selected, a form for editing the settings appears below the list.
After modifying the desired settings, click [Save] to apply the changes.
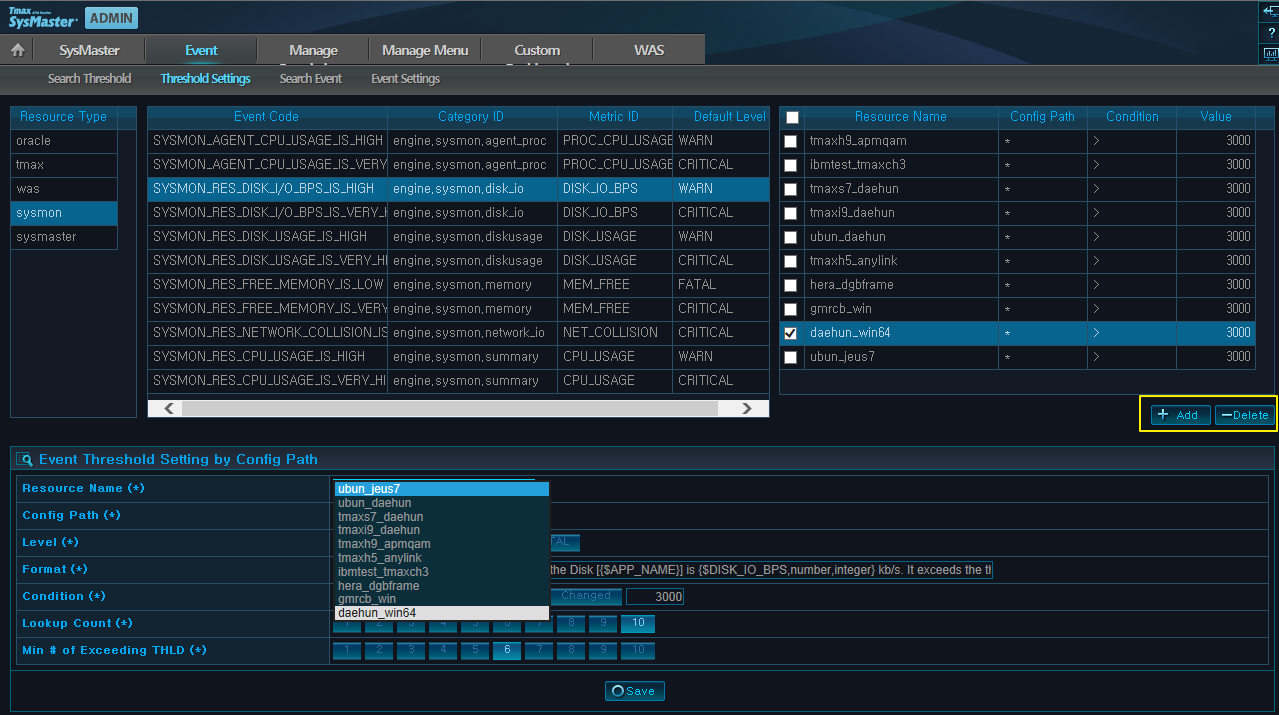
Adding/Deleting Threshold Settings
When a new event has been defined by the user, config paths and threshold settings must be configured in order for the event to be triggered.
When an event code is selected and [Add] button is clicked, the Resource Name combobox will be populated with those related to the selected resource type. When a resource name is selected, the Config Path combobox will be populated with those related to the resource name. If [*] is selected, the event settings will be applied to all sub config paths. After configuring the settings, click on [Save] to finish. To delete, select the config path from the list and then click [Delete].
The following screen shows how to add a threshold setting.
Search Event screen shows a list of event codes that are defined in SysMaster. A conditional search can be performed, and event settings can be modified by selecting an event code from the list and then clicking [Edit] as shown below.
When [Edit] from the previous screen is clicked, the following screen appears.
Event Settings is used to add a new event definition.
SysMaster uses the concepts of category and metric to collect monitoring data. A category is a group of monitoring data with similar characteristics. A metric is a type of data that is collected within the group. In simple terms, a category can be seen as a DB table, and a metric can be seen as a table column. Although SysMaster provides some basic events, the user can define a new event for a particular metric from this screen. As already mentioned, to enable the triggering of the event, threshold settings must be applied for each config path through the Threshold Settings screen after defining the event settings.
The event settings defined here allow threshold settings to be automatically applied to a newly added resource when it gets registered to the relevant resource type.
Modifying Event Settings
Modifying the settings of already registered event does not affect events that are currently registered in Threshold Settings. The changes only affect newly added resources as previously mentioned.
Since an event level is set per event code, level changes must be applied when changes to threshold settings are applied. After changing the level from the Event Settings screen, click [Save] for the related config path from the Threshold Settings screen.
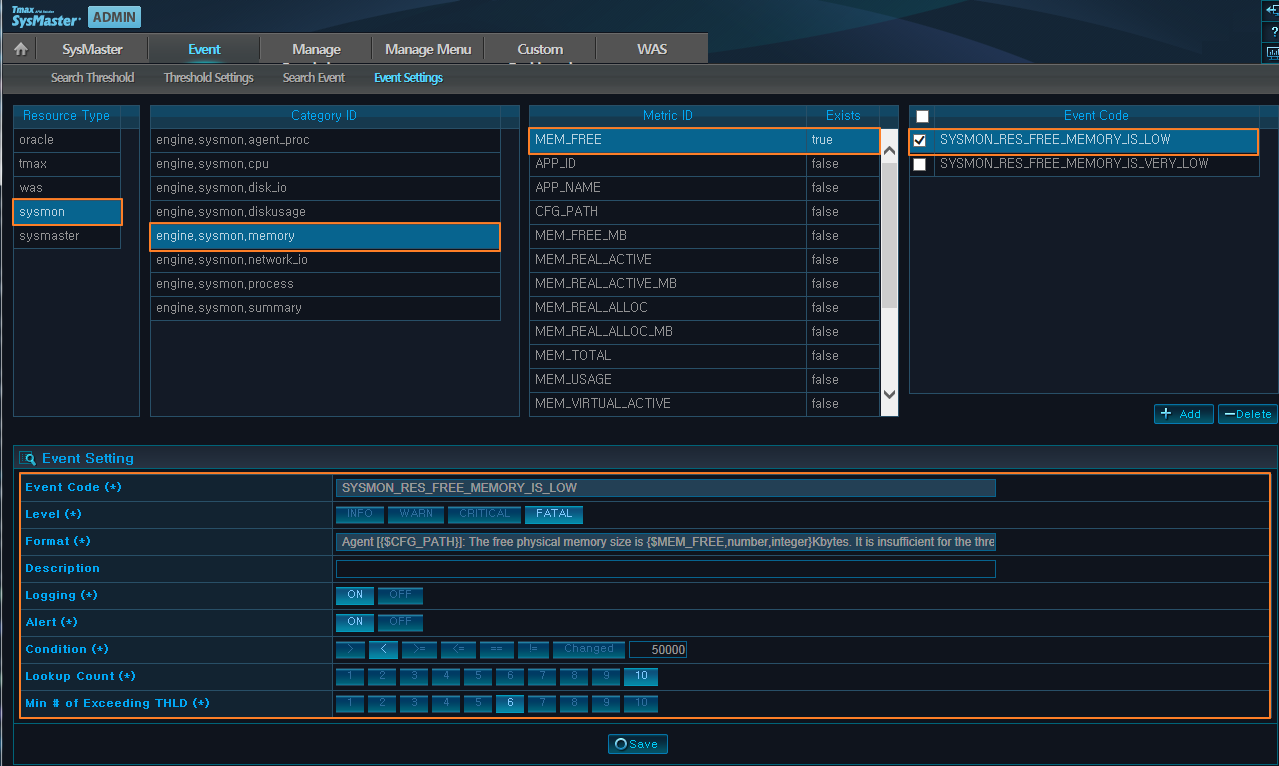
The initial screen only shows the resource type table. Select the desired resource type, category, and metrics respectively to find the registered settings of an event. The 'Exists' column of the metric table indicates whether an event is defined for the metric, and event code is included only for those marked with 'true.' Lastly, if an event code is selected, the related event settings are displayed below.
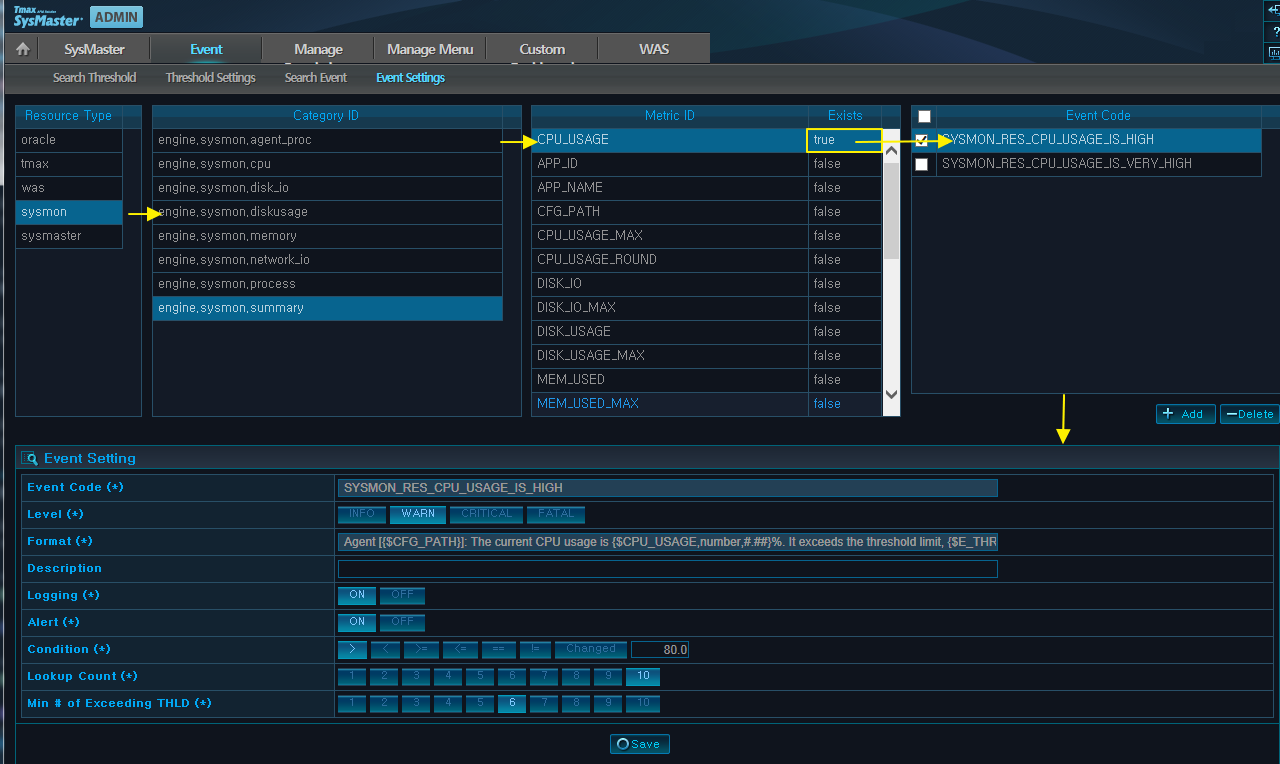
The following screen shows how to change the event level of an already registered event.
The following is description of the key properties.
| Property | Description |
|---|---|
| Logging (*) | Enable recording logs in a file or database. |
| Alert (*) | Enable UI Alert popups. (Enabling Alert popups from the UI is currently not available.) |
Adding Event Settings
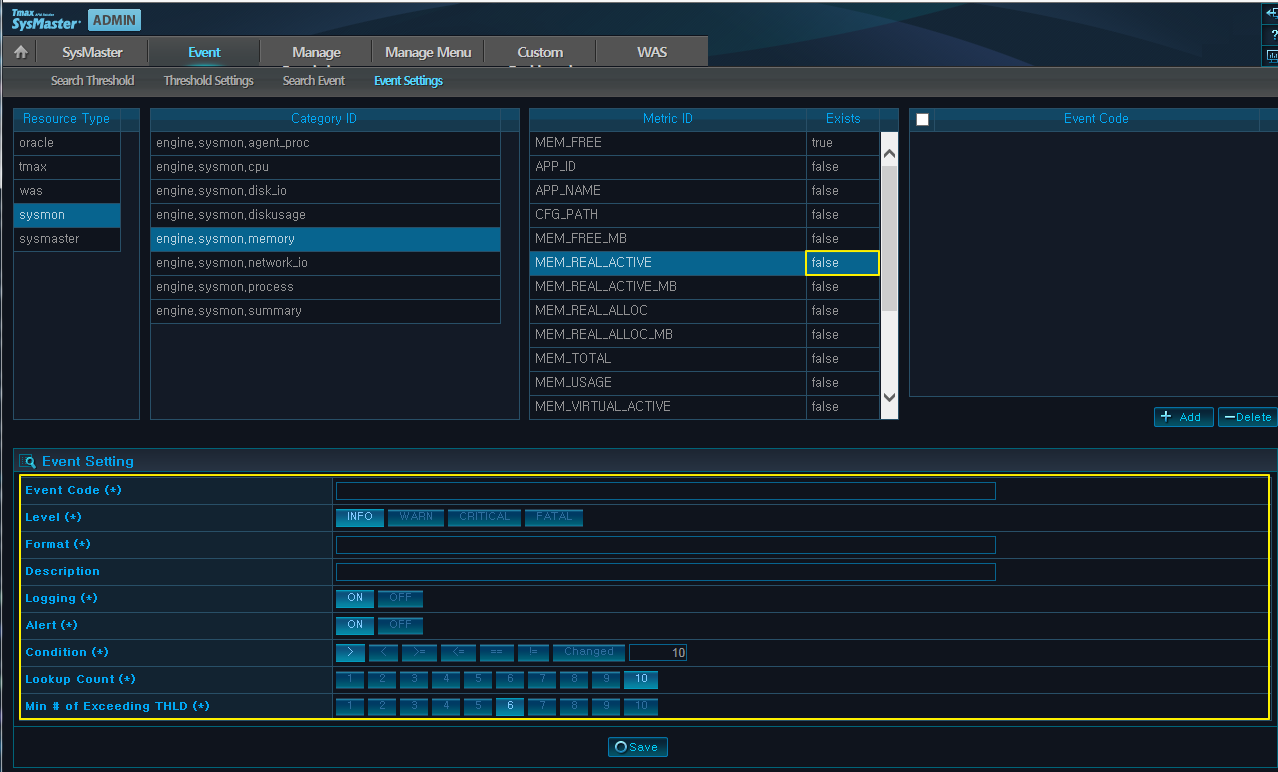
This section describes how to register a new event to a metric with no existing registered events. A metric can be used to describe the Format, which is a detailed message displayed when an event is triggered.
To add an event to the use metric for physical memory called 'MEM_REAL_ACTIVE,' among the Sysmon's memory status data, the relevant metric must be first checked to make sure that no event code exists for the metric. After clicking [Add], enter the settings for the new event and then click [Save].
The following screen shows a completed form before clicking [Save].
To perform monitoring, a user must log in. The permissions granted to the user account can limit what the user can do. SysMaster provides permission settings for the monitoring target and menu configuration settings. Manage Permissions tab is used to grant permissions for monitoring targets by creating roles.
The following describes sub menu items of Manage Permissions tab.
| Menu Item | Description |
|---|---|
| [Permissions] | Create read/control permissions for config path, a monitoring target unit. |
| [Role] | A permission set grouped by task. |
| [User] | Grants roles to the user. A user cannot perform monitoring tasks if no permissions are granted to the user. If the user lacks permissions to perform a task, a popup window will appear with the message, "You have no permissions." |
Read and control permissions can be set for each config path. Read permission is for reading general data, and control permission is for controlling configuration settings including saving, editing, deleting, etc.
Adding/Deleting Permissions
Permissions screen consists of a list of existing permissions on the top and a new permission entry form on the bottom. To add a new permission, click [Add] below the list. Fill in the form and then click [Save].
The following is an example of adding a permission called 'insa2_con2_all' with READ and CONTROL permission for a container with config path alias, 'insa1.con2', of a WAS resource called 'insa1_was_jeus'.
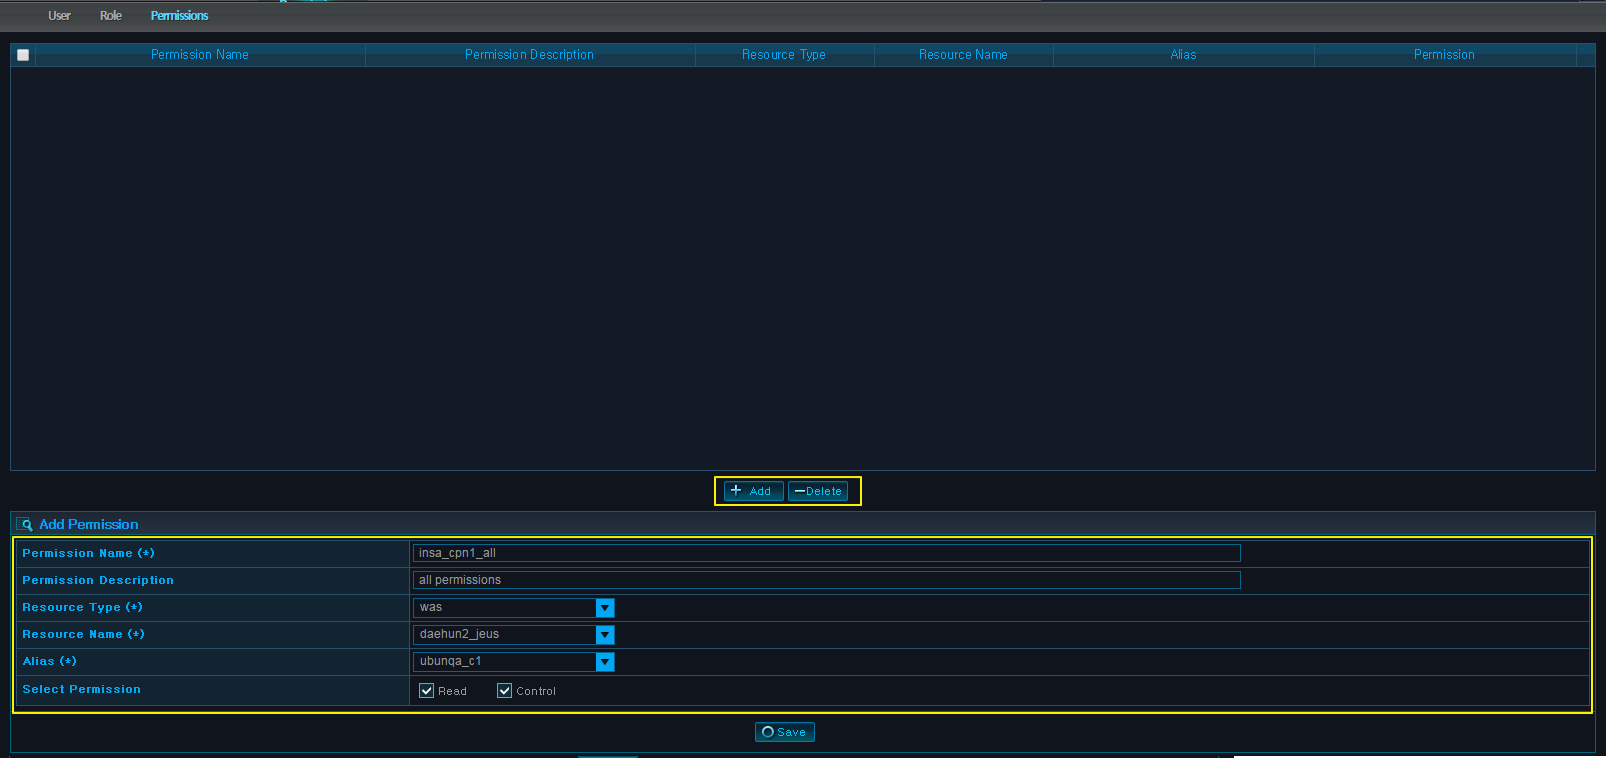
The following is description of the properties.
| Property | Description |
|---|---|
| Permission Name (*) | Permission name defined by the user. |
| Permission Description | Short description of the permission. |
| Resource Type (*) | Resource type, e.g., sysmon,was, etc. |
| Resource Name (*) | Resource name of the parent resource type which is needed to create permission for each config path. |
| Alias (*) | The config path alias defined by the resource. The dashboard uses the alias for manageability. |
| Select Permission |
|
To delete a permission, select the line or the checkbox of the permission to delete from the list and then Click [Delete]. If there are roles using the deleted permission, the permission will also be removed from those roles.
A role is a set of permissions. Instead of directly granting permissions to individual users, for convenience purposes, roles are created based on the user's job functions, so that they can be assigned to multiple users.
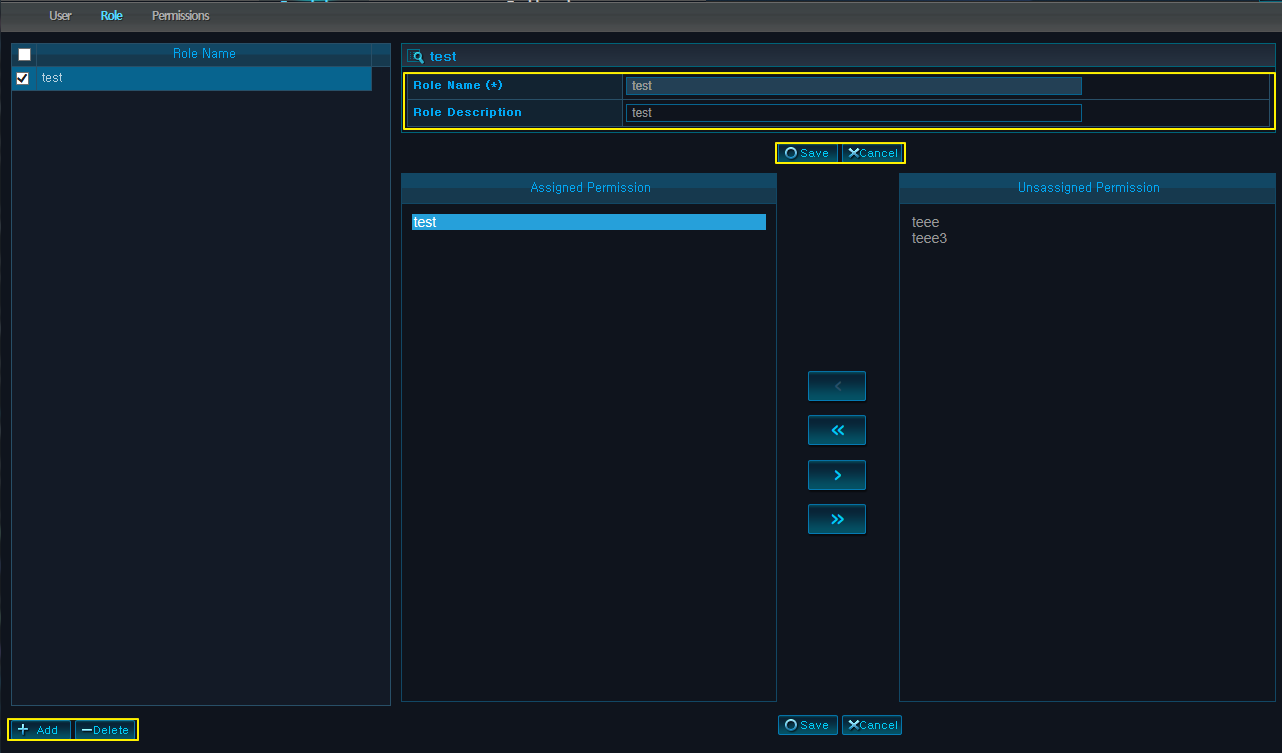
Roles screen consists of a role list on the left and role update and permission assignment form on the right. The role list contains currently existing roles. Select a role from this list to see the name, description, and permissions assigned to the role.
Adding/Deleting a Role
To initialize the form to enter a new role, click [Add] below the list. Fill in the form and then click [Save] to see the new role added to the role list on the left.
To delete a role, select the role to delete from the list and then click [Delete] below the list.
The following is an example of adding a monitoring role called 'test' for HR department's server called 'test.'
Assigning Permissions to a Role
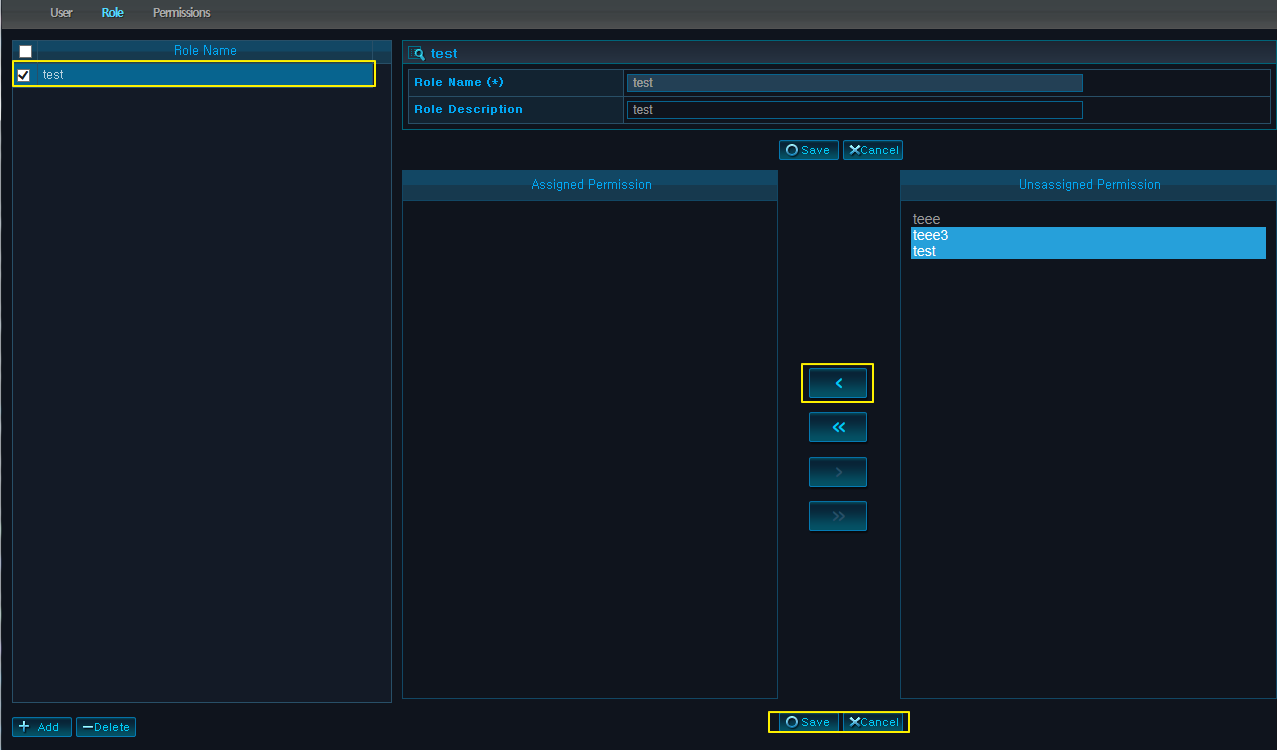
Permissions must be assigned to a role. When a role is selected from the role list on the left, the role information and its permission settings are displayed on the right. A permission can be assigned to multiple roles. Unassigned permissions are those that have not been granted to the selected role.
To assign a role, select a permission from the 'Unassigned Permissions' list and use the highlighted left arrow to move it to the 'Assigned Permission' list, and then click [Save]. A permission can be unassigned by using the right arrow, and the <Ctrl> key can be used to select multiple permissions. Use [<] to move only selected permissions, and use [<<] to move the entire list.
In the following example, 'teee3' and 'test' permissions are being assigned to the 'test' role.
The User screen is used for registering users to perform monitoring in SysMaster. It is also used to place restrictions on the user. User permissions can be restricted through permission settings and individualized menu settings. Permission settings are set by assigning roles, and individualized menu settings are set by assigning the user to a 'User Menu Group'.
Multiple users can use the same SysMaster user account. It is up to the administrator to decide whether to create a separate account for each user. By default, 'SysMaster Admin' user is a superuser with the 'admin' ID, and can perform all SysMaster tasks regardless of the user's roles or permissions. However, The admin account is still restricted by the menu group setting, and it appears in the user list so that its password can be changed. The default password is 'admin.'
The User screen consists of user list on the left and the user information form on the right. When a user is selected from the left table, the user's basic information is displayed on the right and the roles assigned to the user appears on the lower right.
Adding/Deleting a User
To add a new user, click [Add] on the lower left of the screen and the entry form will be reset. Fill in the form and then click [Save]. The new user will appear in the user list on the left.
Since the password is encrypted and saved in the database, the administrator must assign a new password in case the user forgets the password. User menu group is a menu set that is assigned to restrict the menu options that can be seen by different users. Menu groups are described in the 'Menu Group' section.
To delete a user, select the user to delete from the user list, and then click [Delete] below the list.
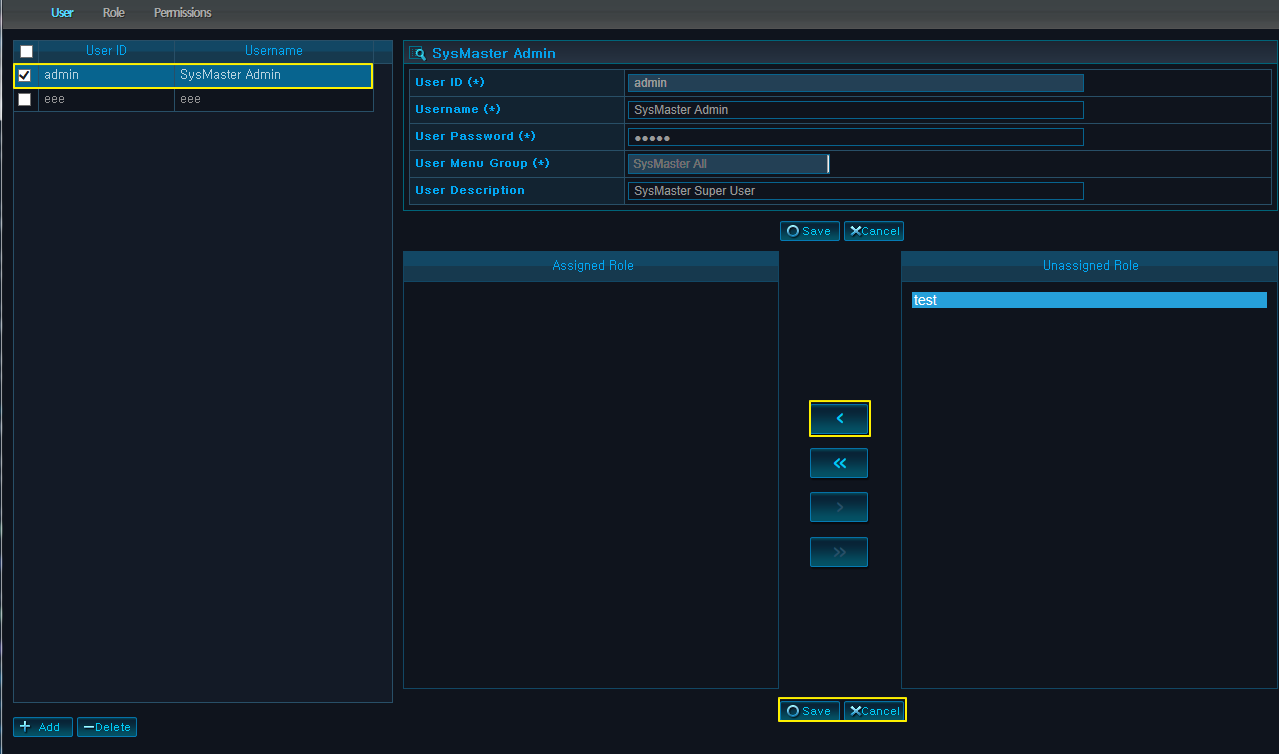
In the following example, a user account called 'eee' that will be used to administer the HR system is created by assigning the user to the 'SysMaster All' user menu group, which can view all menu items.
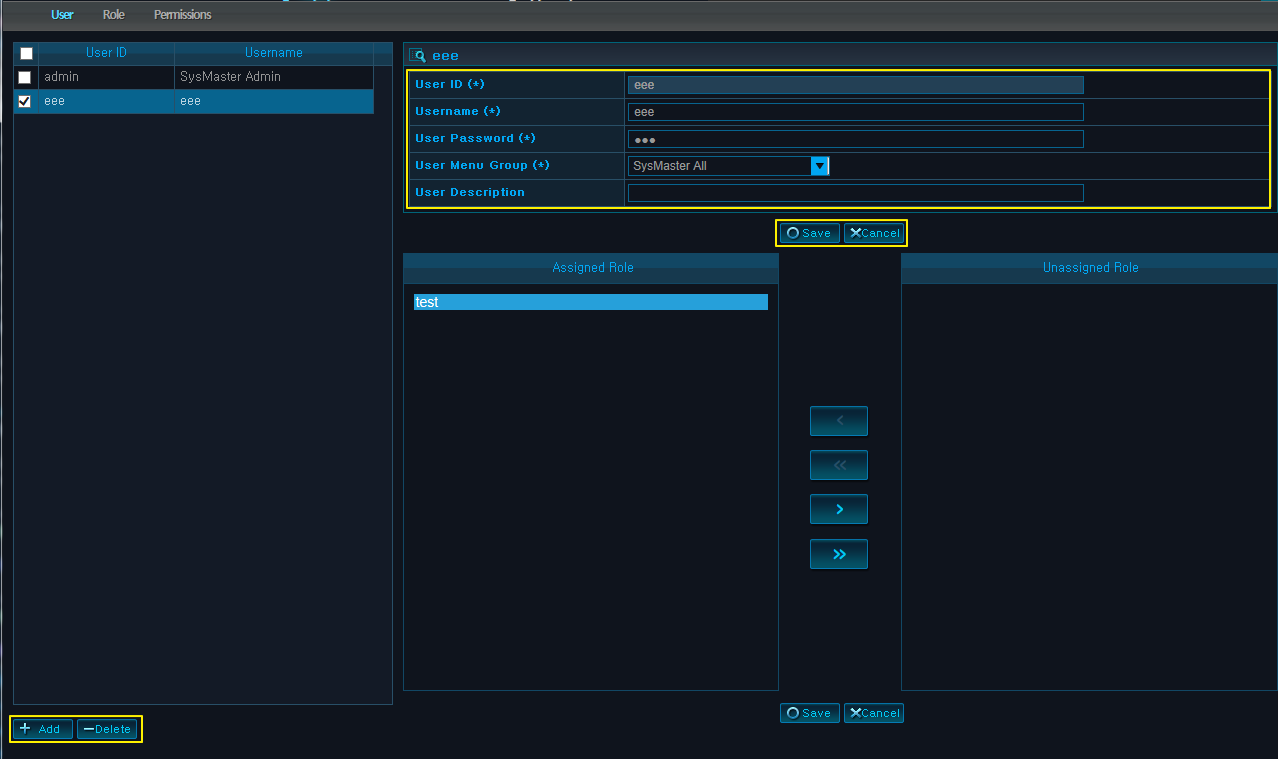
Assigning Roles to a User
Select a user to assign roles to. The method of assigning roles to a user is the same as that for assigning permissions to a role. Select the user from the user list, and move the roles from the 'Unassigned Roles' list to the 'Assigned Roles' list to assign the roles to the selected user, and then click [Save]. The user account can now be used to perform monitoring based on the permissions of the assigned roles.
SysMaster menu can be customized to restrict access to menu items depending on the scope of the user's job. For convenience in configuring menu items to users, a menu group is created for a particular menu setting so that multiple users can be assigned to the group.
SysMaster provides a default menu group. The group 'SysMaster All' includes all menu items for all installed providers including those for the admin section. The default menu group cannot be modified and does not appear in the menu group list, but they can be selected from the user entry form. A menu group is also provided for each of the providers. 'SysMaster Admin' group is for admin, and 'WAS Provider' group is for WAS. Other provider-specific groups, including 'SysMaster WEB,' 'SysMaster Database,' etc., are also provided. A new menu group apart from the provided groups can be created in this screen.
The tree on the left is for viewing and editing the menu settings. The form on the right is used to edit menu group list and group settings.
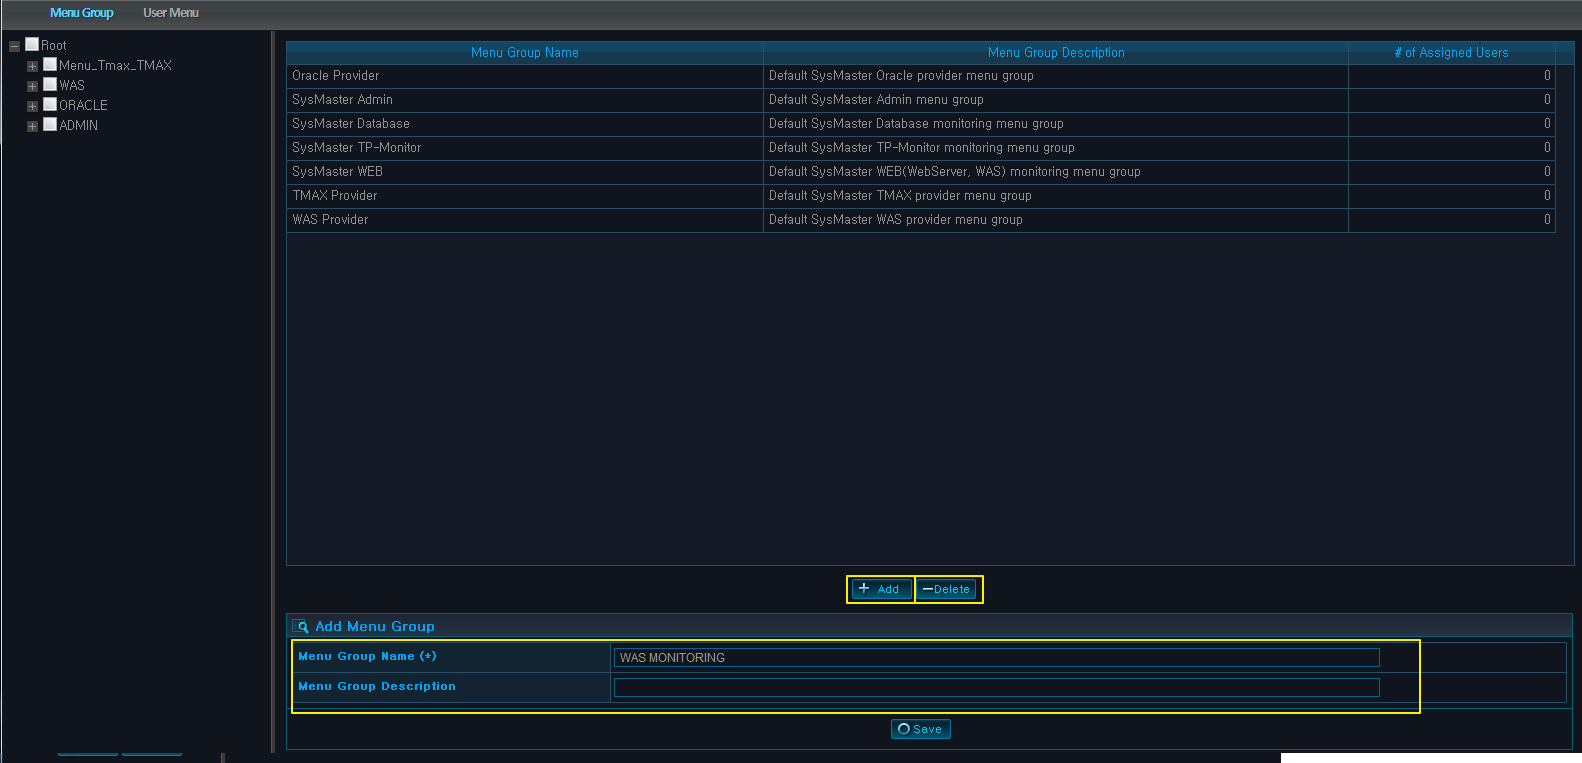
Adding/Deleting a Menu Group
Click [Add] below the menu group list on the right to reset the entry form. Fill in the form and click [Save]. The new menu group will appear in the menu group list. Menu items must be assigned to the newly added menu group.
To delete a menu group, select the group to delete and then click [Delete]. A menu group can be deleted if the '# of Assigned Users' for the group is 0. If this number is greater than 0, the group cannot be deleted since there are users assigned to the group. The group assignment must be removed from the User Menu screen of all users assigned to the group before the group can be deleted.
In the following example, a new menu group called 'WAS Monitoring' is added.
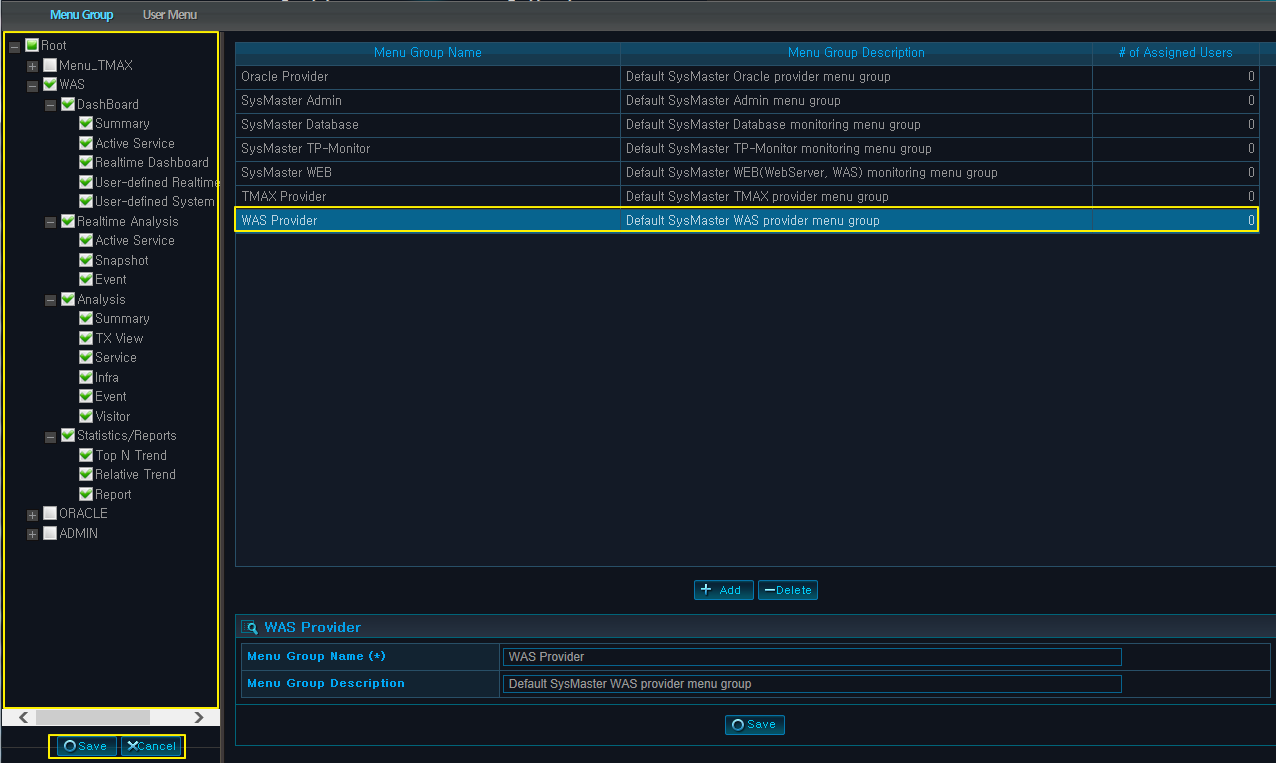
Assigning a Menu
A menu is assigned to a newly added menu group, or to modify an existing menu group setting. Select a menu group from the menu group list, check the menu items from the left tree to assign them to the menu group, and then click [Save].
There are two ways for a user to assign a menu group. First is assigning an individual user to the menu group, and the second is to use the User Menu screen. It is more convenient to assign multiple users to a menu group from the User Menu screen instead of assigning each user to the role.
To the left of the screen is the menu group list, and to the right is for assigning users to the group.
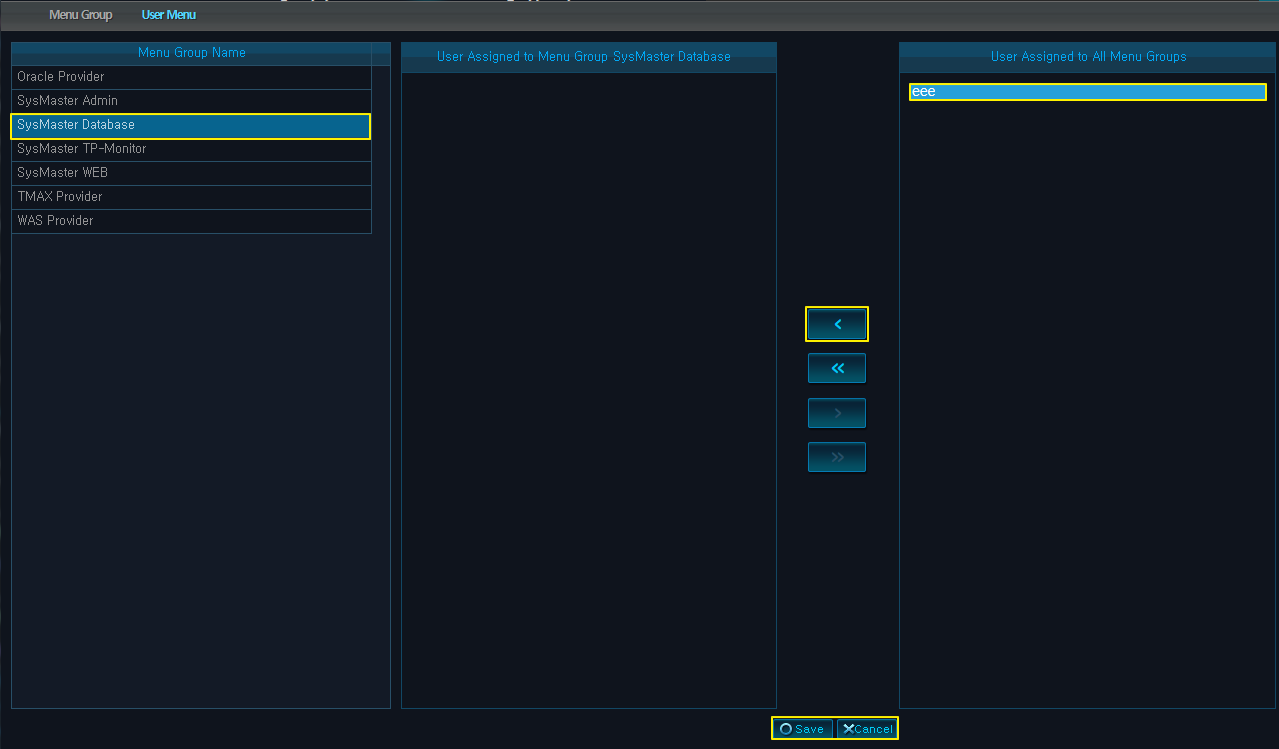
Assigning Users to a Menu Group
The list on the left of the user assignment area is a list of users assigned to the selected menu group. The list on the right is a list of users assigned to the 'SysMaster All' group.
First, select a menu group from the left menu group list, select and move users from the right list to the left list to assign them to the selected group, and then click [Save].
In the following example, a user called 'eee' is being assigned to the menu group called 'SysMaster Database'.
SysMaster provides dashboards in various formats. To provide a better monitoring environment for different users who require different information, SysMaster allows the user to customize the dashboards and reports according to the user's needs. The user can customize the report format to show only the items the user needs to see.
The dashboard and report created from this screen will appear as submenus of dashboard and analysis menus of the provider's menu, respectively. The custom dashboards and reports are managed per User ID and can only be seen by the user who created them. Only the dashboard screen will be covered here since the dashboard and report screens only differ in their widget types.
The dashboard screen consists of the widget list on the left, the action buttons on the top right, and the board on the bottom right.
The widget list consists of items that can be displayed in the dashboard such as charts and tables. The action buttons are for various dashboard management functions. The board is where various widgets can be placed to create the dashboard.
Creating Dashboards
A user can create a custom dashboard by entering its name and laying out the widgets.
The dashboard name can be changed from the initial screen by directly entering the name in the textbox with the 'User-Defined Dashboard' text, or by clicking [New] and entering the name in the popup window. Use the latter method if creating a new dashboard after performing another action to reset the screen.
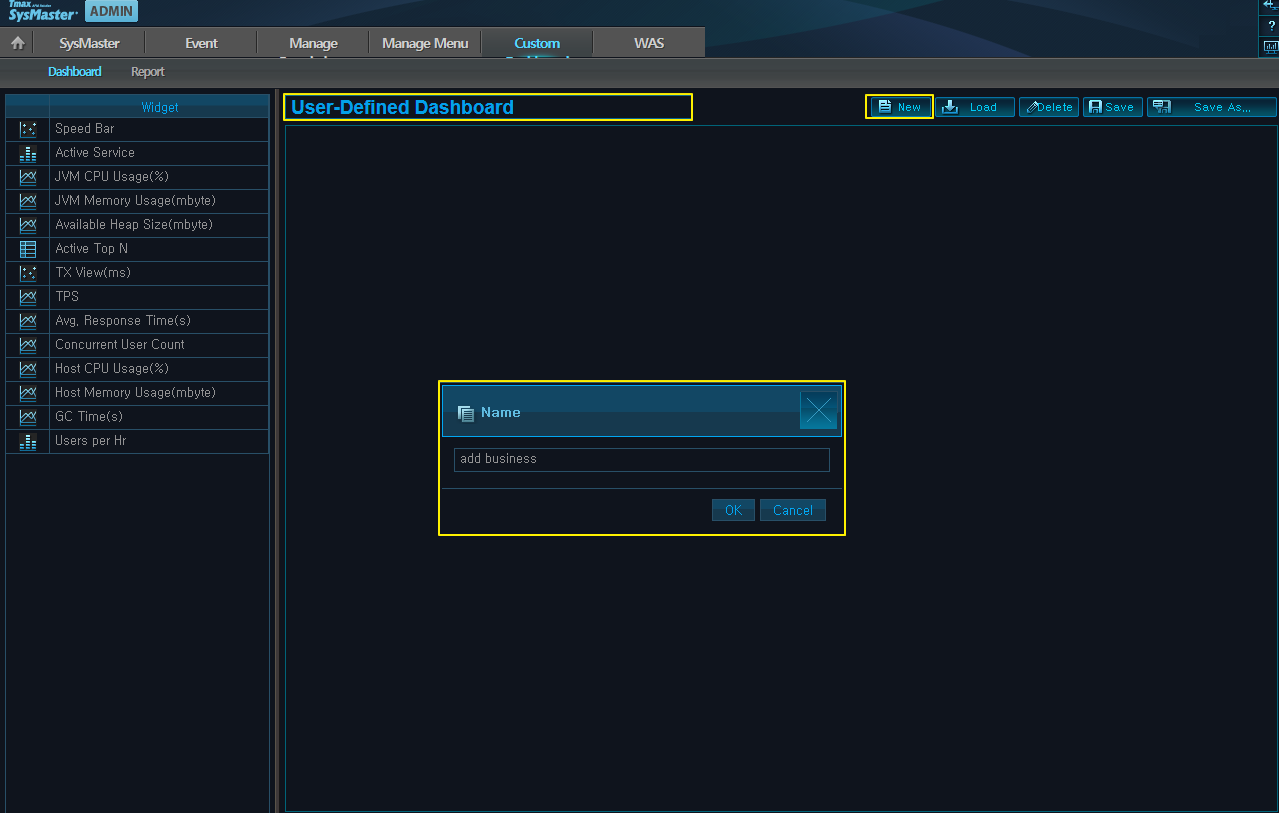
After entering a new dashboard name, the board is ready to be configured.
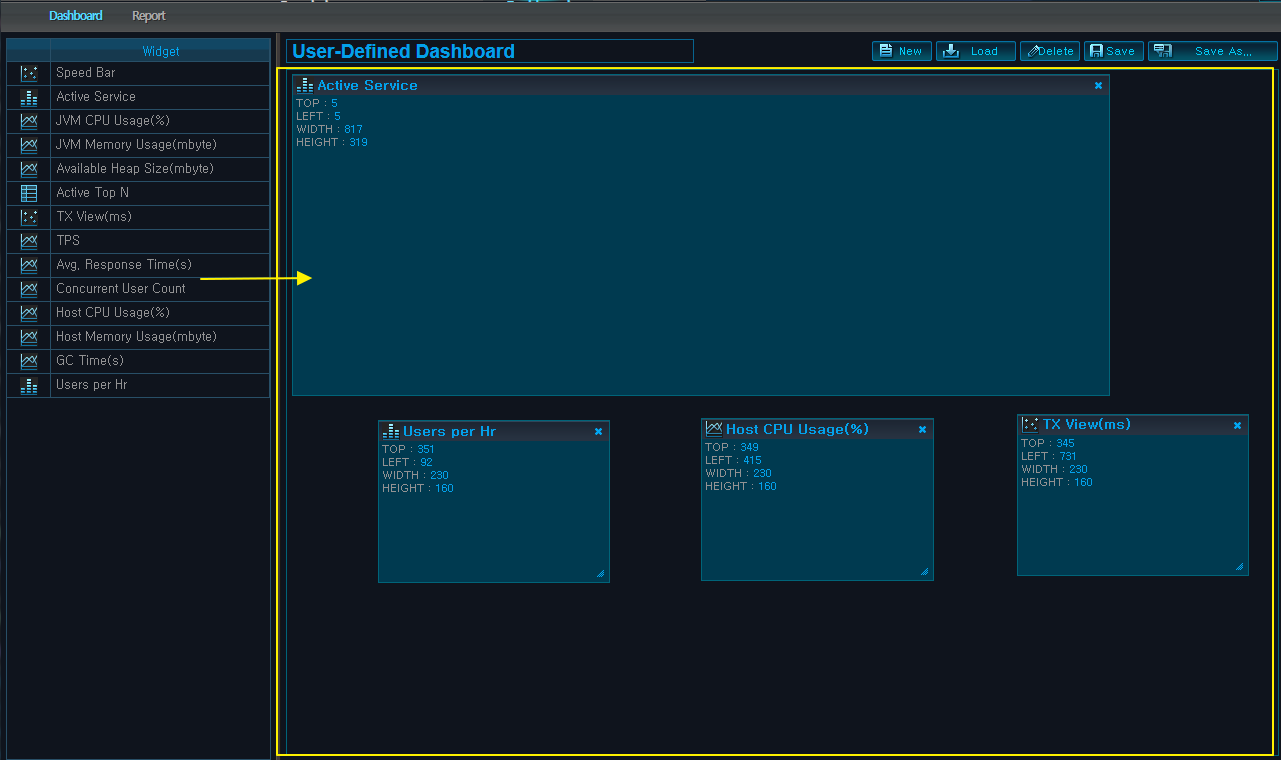
To the left of the screen is the list of widgets that can be used. Click on the widget and use the drag & drop method to place it on the board. The widget size and location can be adjusted by using the borders. Location can be changed using the drag & drop method, and the size can be changed by dragging the bottom and right borders or the lower right corner of the border.
To delete a widget, click [x] on the upper right corner of the widget. The 'Speed Bar' and 'Active Service' widgets cannot be resized. The board shown here is not th actual size of the dashboard, but the board layout will be resized proportionally to fit the actual dashboard screen.
The chart type of the widget can be distinguished through the icon in the widget list. 'Speed Bar' and 'Active Service' are individual types.
| Icon | Description | Icon | Description |
|---|---|---|---|
| Scatter chart | Line chart | ||
| Stackbar chart | Table |
After configuring the board, click [Save] to save the new dashboard.
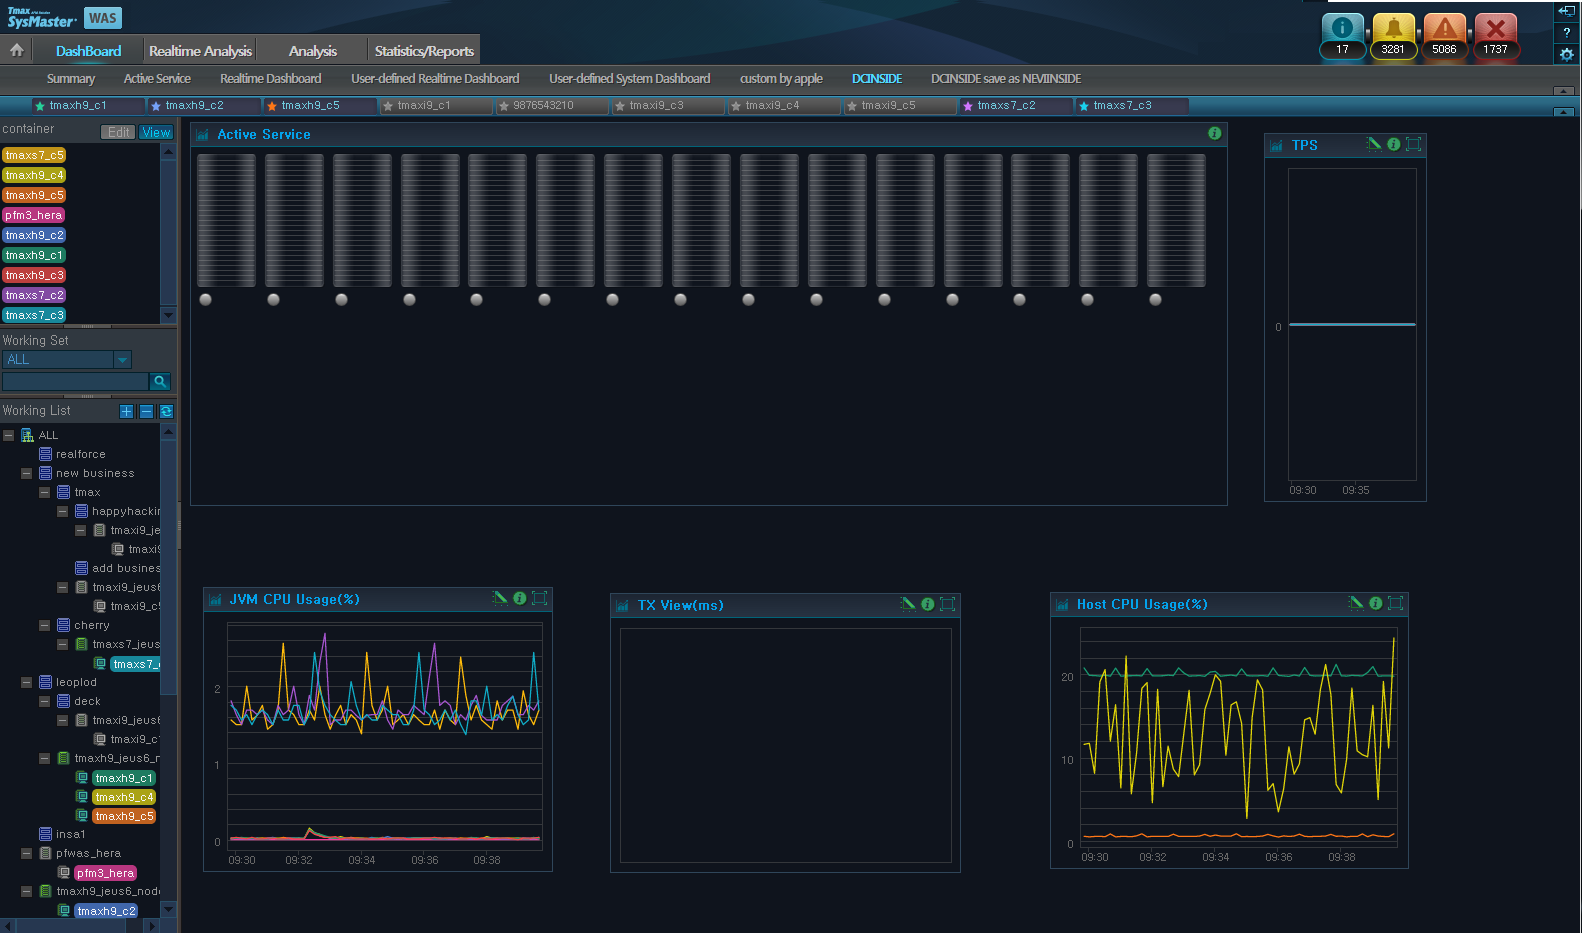
Once the dashboard has been saved, the custom dashboard can be seen in the monitoring screen, accessed from the sub menu of the Dashboard menu.
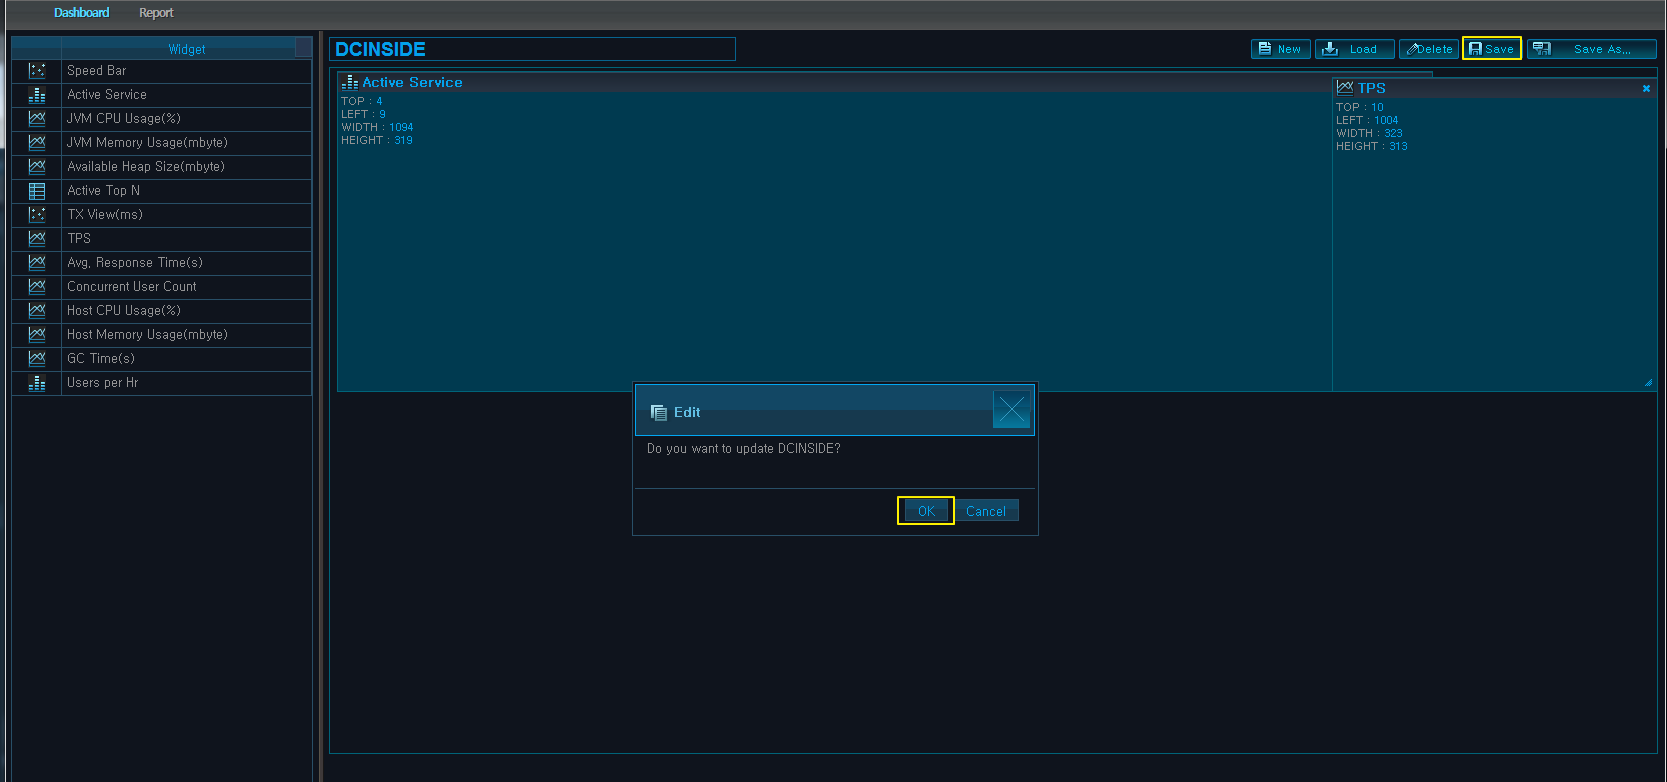
Modifying Dashboards
A user can modify custom dashboards. To load an existing dashboard, click [Load], select a dashboard from the popup window, and then click [OK].
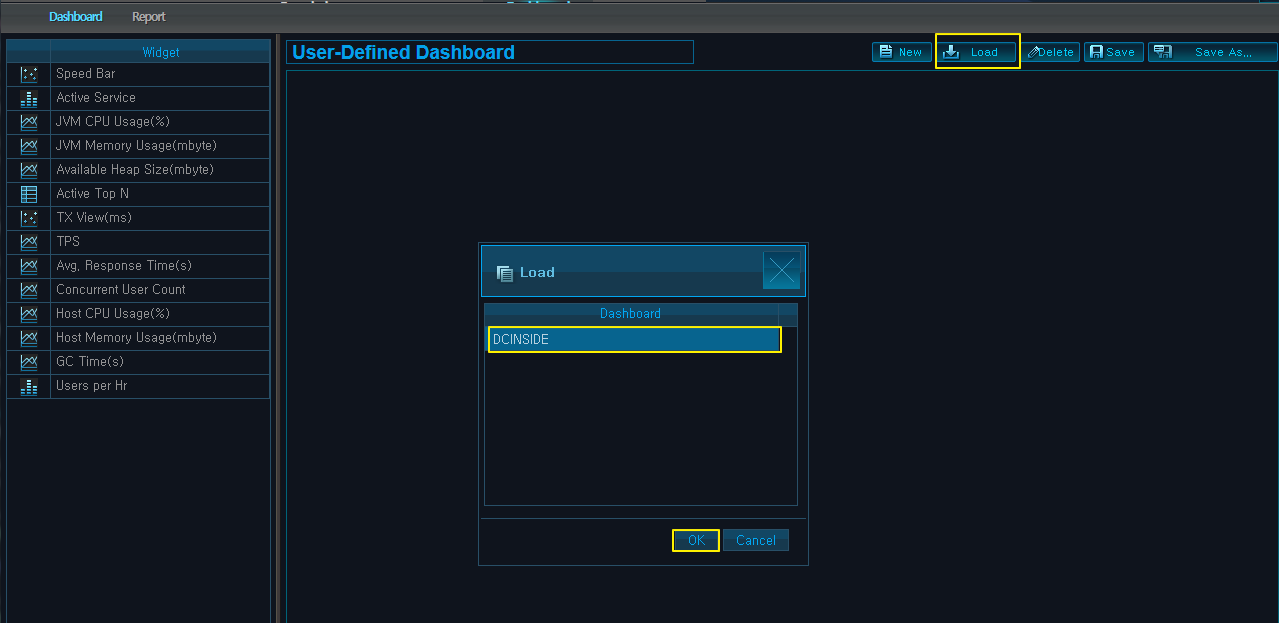
Once the dashboard is loaded on the board, it can be modified in the same way as when it was created, and the name can be changed directly in the name textbox. Click [Save] to apply the changes.
In the following example, a dashboard named 'DCINSIDE' is updated and then saved.
Saving a Dashboard Under Another Name
To create a new dashboard that is similar to an existing dashboard, use [Save As] to duplicate the existing dashboard's settings. Load the dashboard to duplicate and save it under another name. Load the duplicated dashboard and modify it as needed and then save the changes.
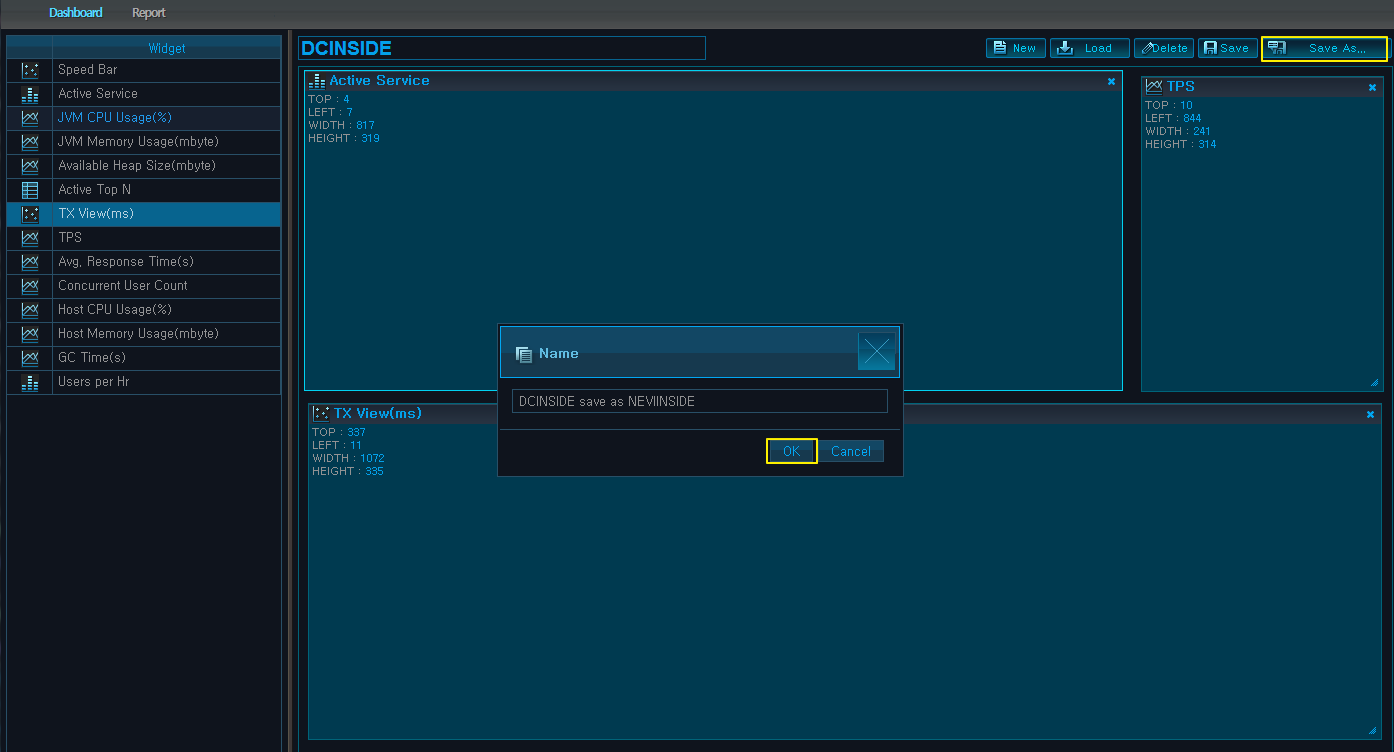
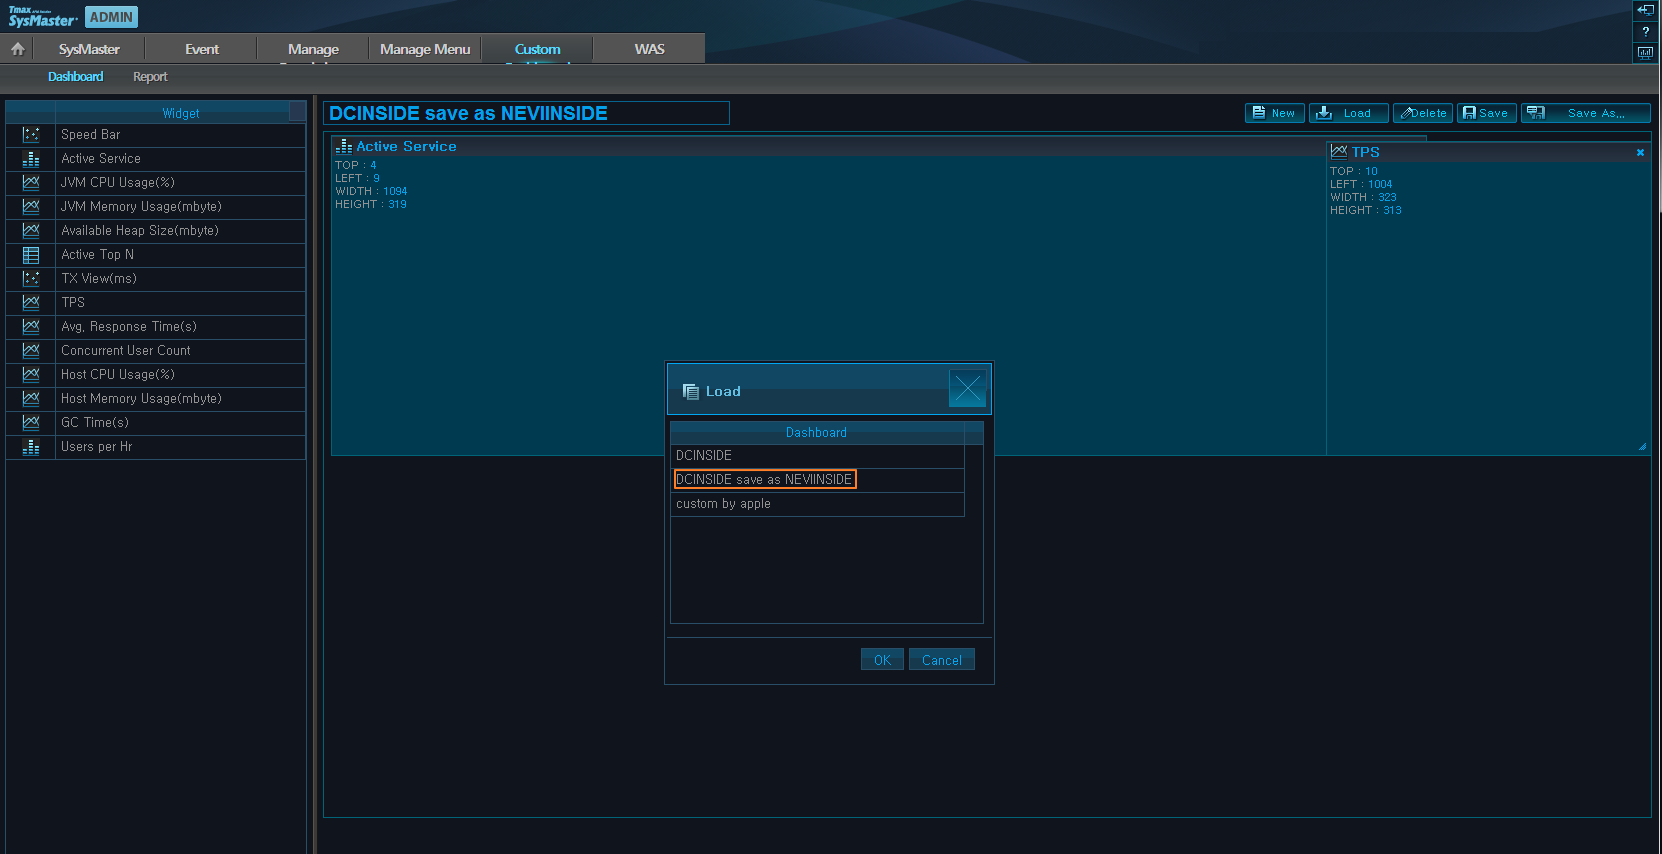
Click [Load] to check that the duplicate dashboard has been created under the new name.
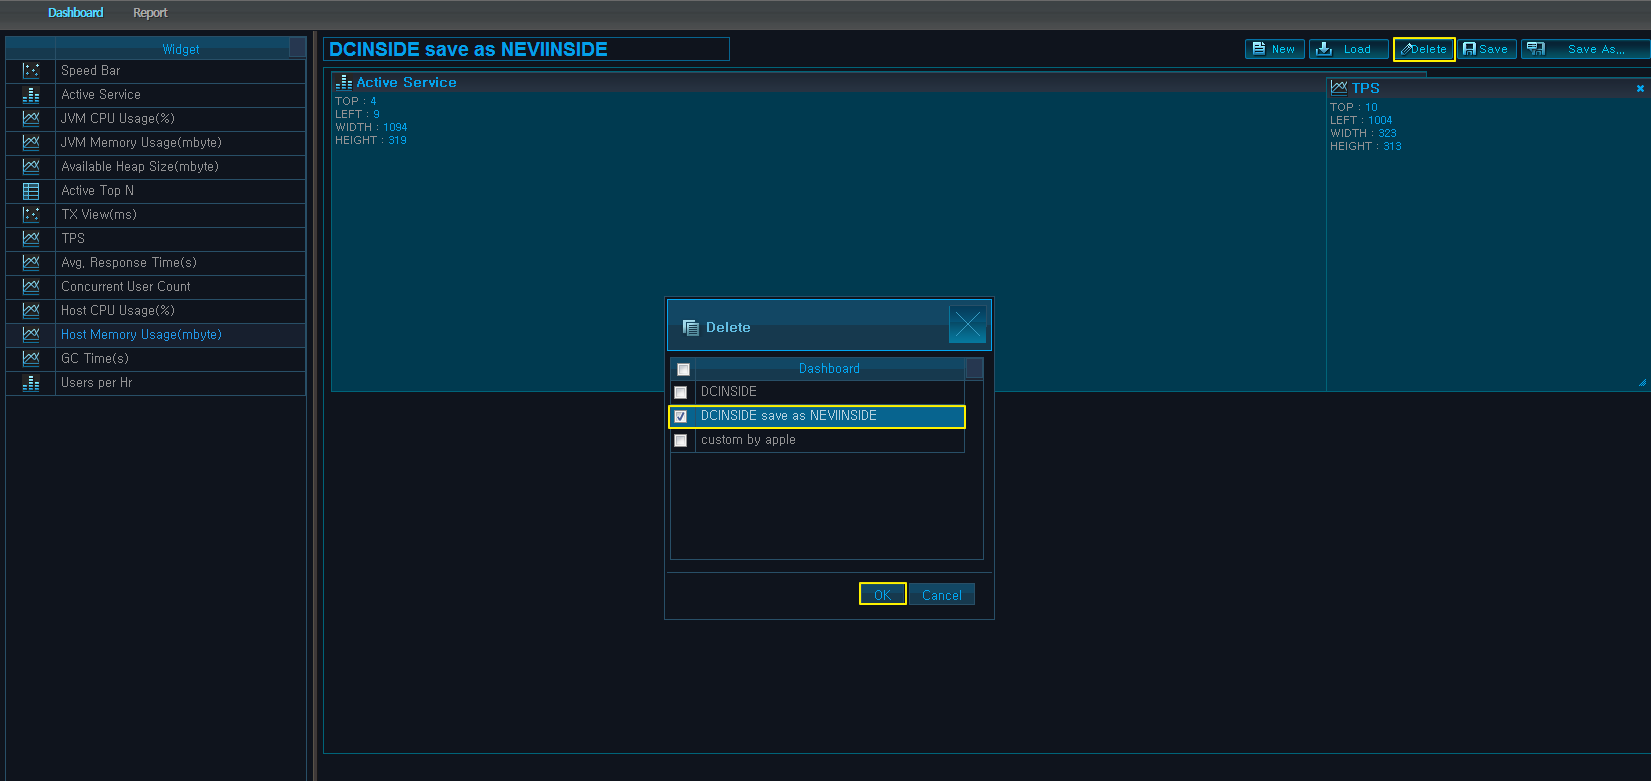
Deleting a Dashboard
To delete a dashboard, click [Delete], and a popup window will display a list of existing dashboards. Check the dashboard to delete and then click [OK].
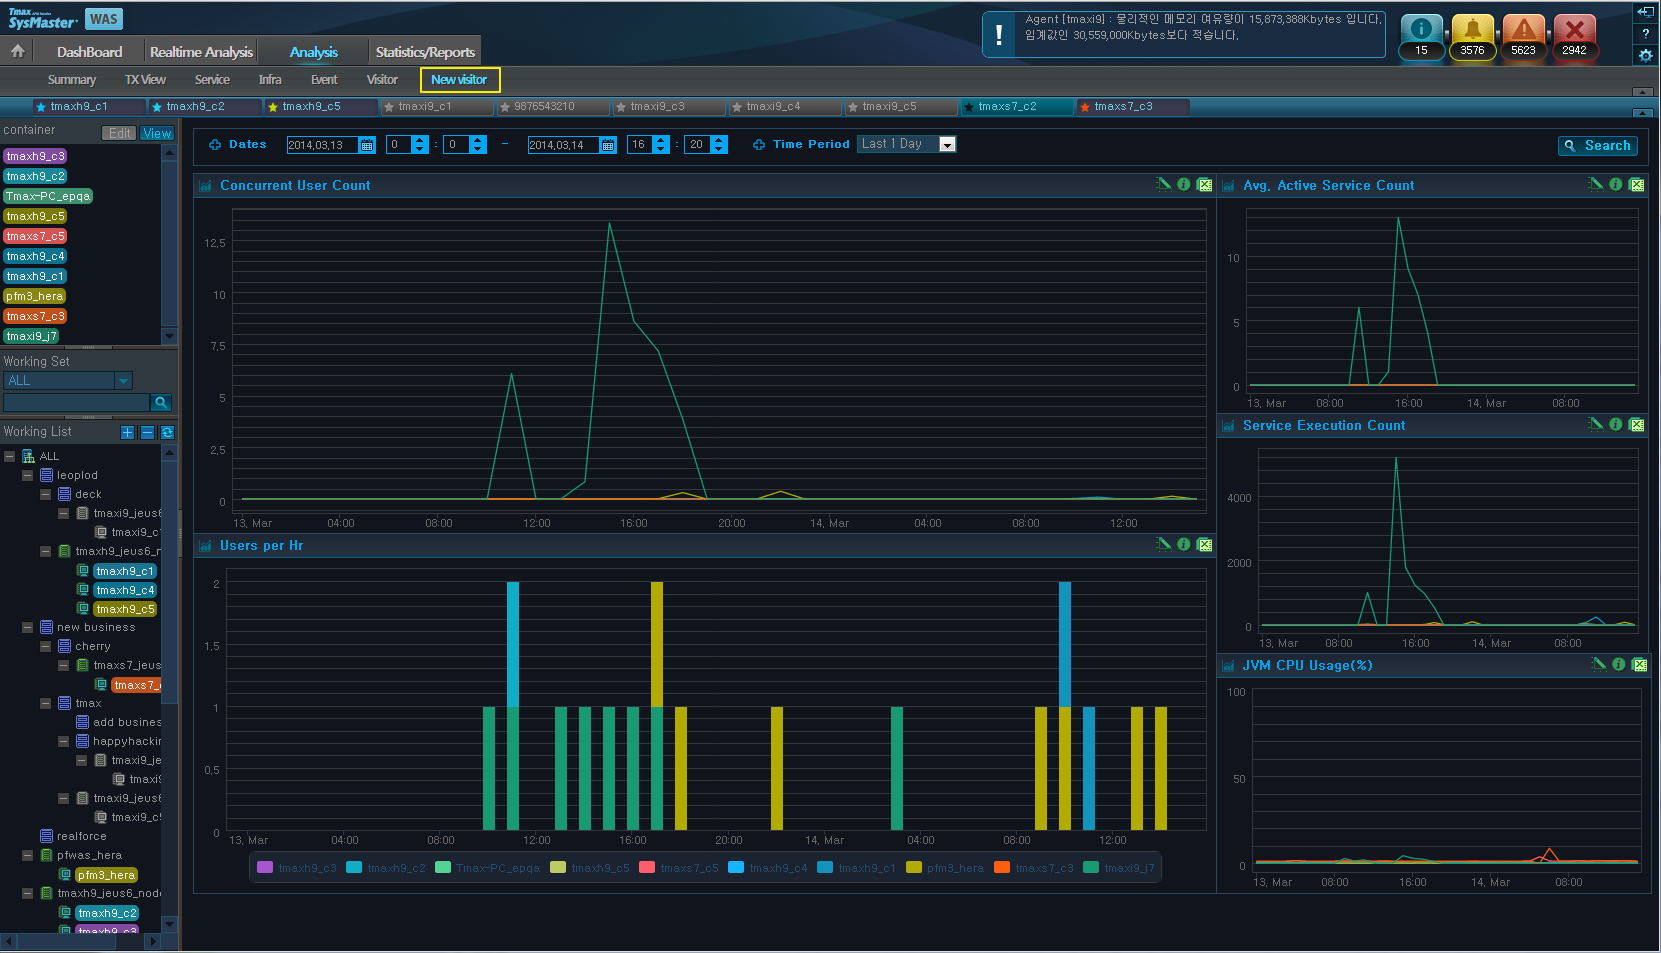
Using the report screen is same as that for a dashboard. The difference is in the types of widgets available and that it appears as a sub menu in the Analysis screen.
In the following example, a customized report called "New visitor" is created, and its result is shown in the Analysis screen.
The administrative menus for configuration, control, etc. for WAS providers are included in the ADMIN screen.
When collecting monitoring data from WAS, settings for various thresholds and whether to enable data collection can be configured for each container from the Property screen. Refer to the Description column of the list for information about each properties.
The WAS node tree is displayed on the left of the screen. It contains a list of nodes and containers that were registered under the WAS resource during the registration of the Agent. Similar to the working set in the monitoring screen, the node and container names are displayed using their aliases. If a search text is entered in the search textbox above the tree menu, all nodes of the tree that contains the search text will be highlighted in orange.
Click on a container node from the tree, and its properties will be displayed on the right. Directly modify the properties in the Value column of the table, and then click [Save] to save and apply the changes.
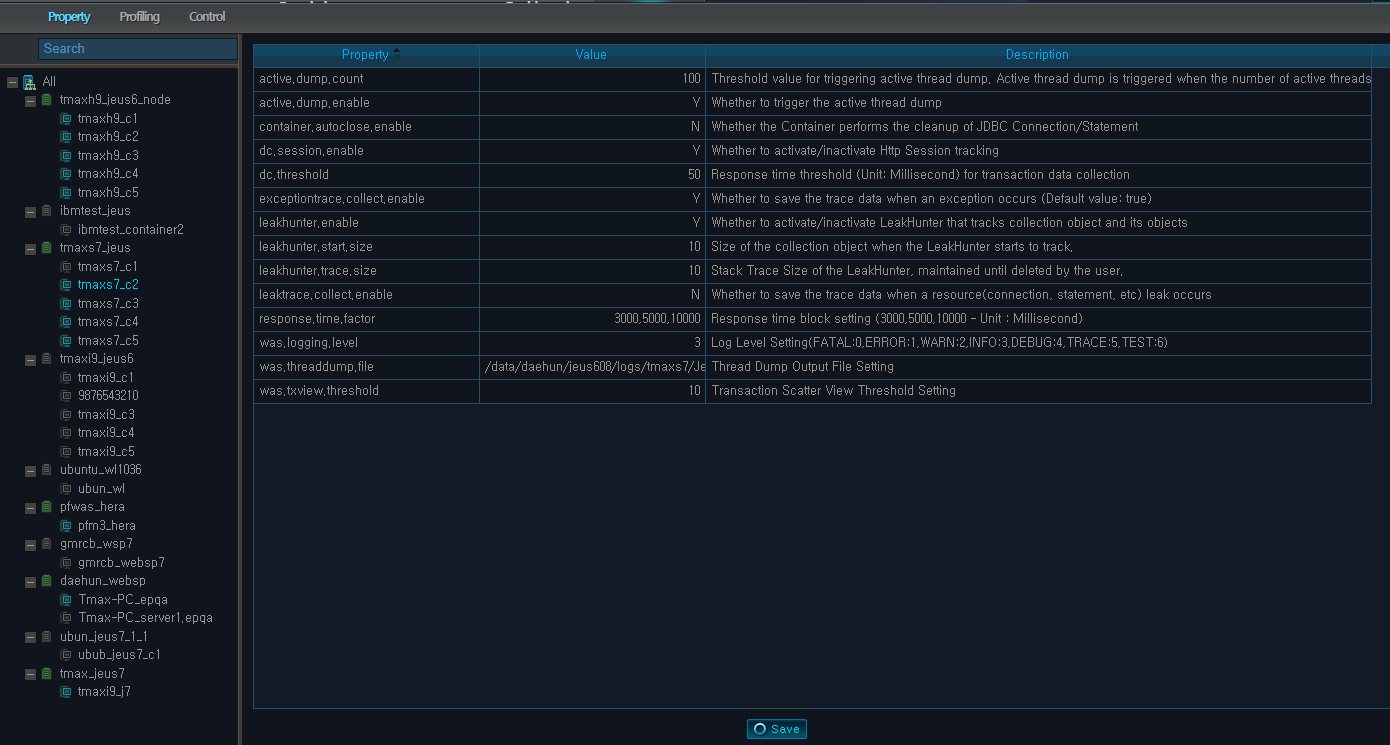
The following is description of the container properties.
| Property | Description |
|---|---|
| active.dump.count | Automatically generates a dump file when the number of active threads reach the specified limit. Used for post analysis purposes. If active.dump.enable is set to 'Y', a dump file of the form 'Active_TxDump_time.dmp' is created in the '$WAS_DC_HOME/dump' directory. |
| active.dump.enable | If set to 'Y', data is not displayed in the [Resource] tab when collecting the infrastructure resources and data for the trace level.
|
| container.autoclose.enable | Works same as in DC. |
| dc.session.enable | If this is enabled to analyze session values, they appear in the [Realtime Analysis] > [Snapshot] > [Session] tab. |
| dc.threshold | Response time threshold for collecting transaction data. (Unit: Millisecond) |
| exceptiontrace.collect.enable | Option to save the trace when an exception occurs. (Default: Y) |
| response.time.factor | Response time range. Can be viewed in the [Summary] tab. (Range: 3000/5000/10000, Unit: Millisecond) |
| was.logging.level | Log level.
|
| was.threaddump.file | Dump file is displayed through smagent by reading the file specified in was.threaddump.file. |
| was.threaddump.file | Threshold value for marking a transaction in the TX View. If set to 10, only services that are processed within 10ms or less appear in the TX View. |
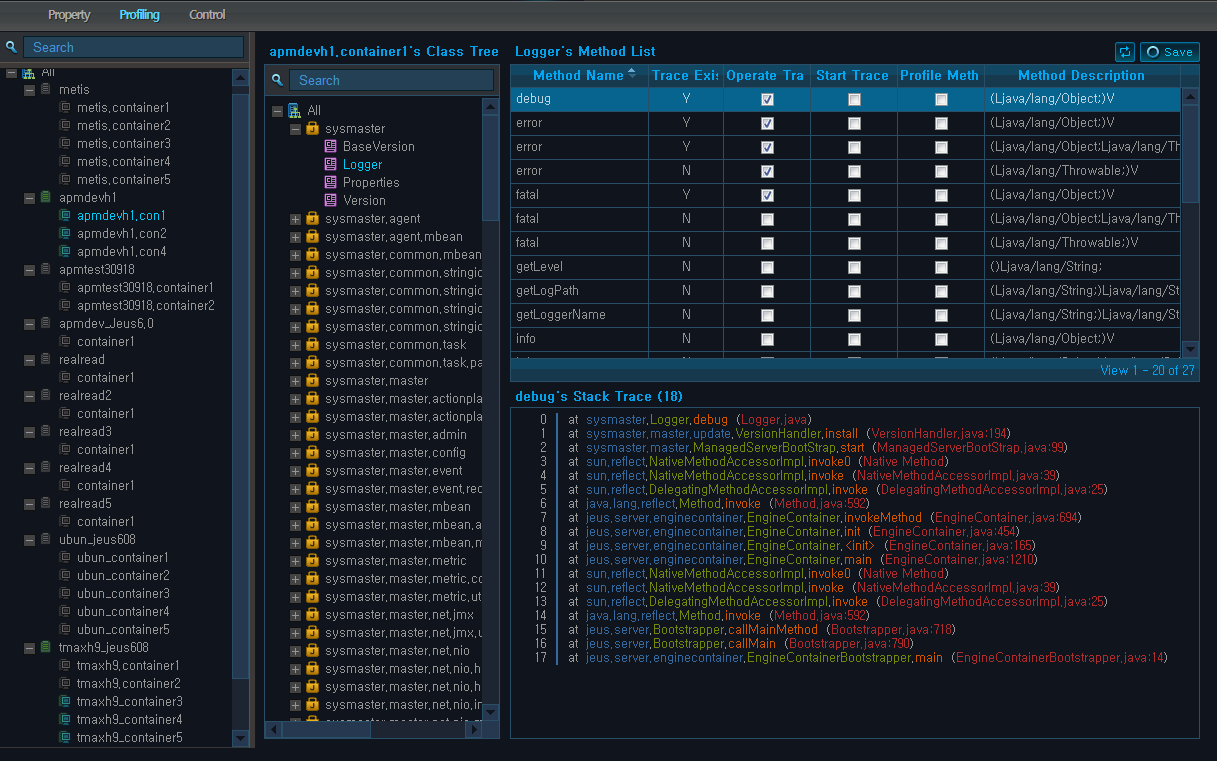
The java classes monitored by the transaction trace of SysMaster for WAS only includes the basic classes included in the J2EE specification. In order to monitor user-defined Java classes, they must be included in the DC and BCI settings, and the class methods must be configured for monitoring through the [Profiling] screen.
When a monitoring target container is selected from the left tree, the classes that the user added to the Container's Class Tree will appear in a form of a tree. Select a class from the tree to see a list of methods in the Class's Method List. This list can be used to set the Trace function for a method. When a method is selected from the Class's Method List and the method has an existing trace history (Trace Exists = Y), its history will be displayed in the Method's Stack Trace.
A method's Trace setting can be configured in Class's Method List. Check the relevant checkboxes and then click [Save] on the top right of the screen.
The following is description of the Trace properties for Class's Method List.
| Property | Description |
|---|---|
| Method Name | Method Name |
| Trace Exists | Whether there exists Trace data. |
| OperateTrace | If set and if there exists Trace data for the selected method, Method's Stack Trace will be displayed on the bottom. |
| Start Trace | If set, assigns the selected method as the starting point of the Trace. |
| Profile Method | If set, includes the selected method in the WAS Trace. |
| Method Description | Description of the method. |
Note
To monitor user-defined Java classes (Extend BCI), the user must specify the classes that are not included in the J2EE specifications. For more information about the user-defined BCI settings, refer to the "SysMaster Installation Guide."
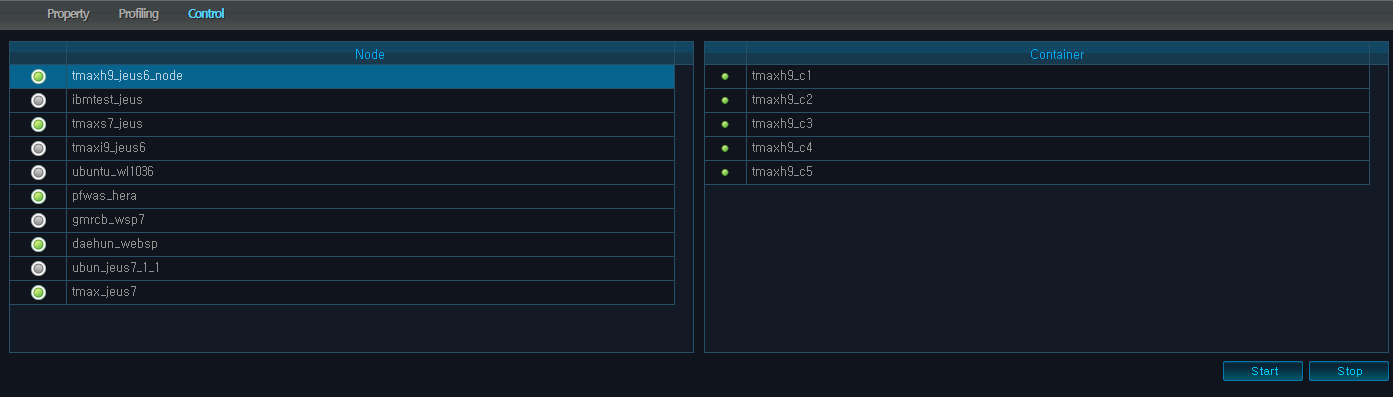
Control screen consists of the start/stop functions for monitoring target containers. The Node list on the left of the screen shows a list of nodes that are registered as monitoring targets. Each node has an icon that shows the Agent status. Green means that the Agent is 'Ready', and gray means it is 'Not Ready.' When a node is clicked, 'The Container' list on the right shows a list of containers that are registered with the selected node. As in the node list, the icon is an indicator of the container's status.
Select a container and click [Start] or [Stop] to start or stop the container. The Node(Agent) must be in the 'Ready' state in order to start or stop the container.