Debug Tool
This chapter describes the debug tools provided by OpenFrame ASM (hereinafter "OFASM").
1. ofadbg
ofadbg is a tool for tracing code executed by OpenFrame Assembler and displaying related information.
The following shows how to use ofadbg:
ofadbg <port number>
|
ofadbg debugging is only available in the ofasm debug binary. |
-
Code Modification
The OFADBGREG 220 command must be inserted at the point where debugging is to be performed. When the command is executed, a socket server for debugging is created and enters a waiting state for socket connections.
TESTASM  CSECT
         LR 12,15
         USING TESTASM,12
         ST    14,SAVEAREA
         OFADBGREG 220
         L     2,0(1)
         L     3,4(1)
         MVC   P1(4),0(2)
         MVC   P2(4),0(3)
         CALL  TESTCOB,(P1,P2),VL
         L     14,SAVEAREA
         BR    14
*
SAVEAREA DS    F
P1       DS    CL4
P2       DS    CL4
         END
When the OFADBGREG 220 command is executed, the following message is displayed. Execute the command according to the message.
OFASM: OFADBGREG[220], CONNECT DEBUGGER Please run this command "ofadbg 41353", Port is "41353" -
Compilation
To use ofadbg, compile the program using ofasm -g to generate the asmo object code that contains debugging information.
ofasm TESTASM.asm -g -
Tool Execution
Start debugging using the ofadbg tool. When a connection is established to the socket server in waiting state, the code of the currently running asmi file is displayed.
ofadbg 41353 -
Console Output
When the ofadbg tool is successfully executed, the following console screen is displayed.
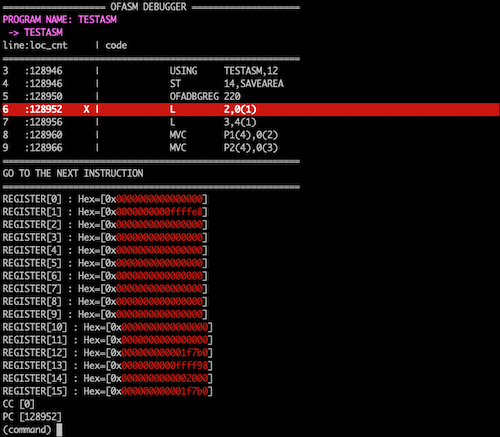 ofadbg Console Screen
1.1. Commands
ofadbg supports various commands for code tracing and information output. The following describes each command.
| Command | Description |
|---|---|
break(b) [<entry>:]<line_number> |
Sets a breakpoint. When setting a breakpoint, an entry can be specified. If not specified, the breakpoint is set for the currently running entry. Afterwards, use the continue(c) and run(r) command to move to the breakpoint.
|
break(b) list |
Displays a list of all breakpoints set so far. |
delete(d) |
Deletes a breakpoint by specifying its index.
|
display(dis) <symbol>|<address> [[offset:][length]] |
Registers a specific symbol or address as a value-tracking item. The offset is valid only when a symbol is specified. If the length is not set, it defaults to the allocated size for a symbol, or 4 bytes for an address.
|
display(dis) list |
Displays the value-tracking items for symbols registered so far. |
display(dis) remove(rm) <index> |
Removes the value-tracking item corresponding to a specific index.
|
set register(reg) <register_num> <hex>|<decimal> |
Assigns a value to a specific register. The value can be either an integer or a hexadecimal value.
|
set variable(var) <symbol_name> <hex>|<string> |
Assigns a value to a specific symbol. The value can be either a string or a hexadecimal value.
|
set address(addr) <address> <hex>|<decimal> |
Assigns a value to a specific address. The value can be either an integer or a hexadecimal value.
|
print(p) <symbol> [[offset:][length]] |
Prints the value of a specific symbol. The offset and length can be specified. If omitted, the length is set to the size of the symbol.
|
print(p) <address> [length] |
Prints the value for a specific address. If the length is not set, it defaults to 4 bytes. The address value can be either an integer or a hexadecimal value.
|
print(p) <d(x,b)> [length] |
Prints the value at the address determined by the specified register format. If the length is not set, it defaults to 4 bytes.
|
set listsize <value> |
Sets the number of code lines displayed in console mode. This command is valid only in console mode.
|
tui |
Switches from console mode to TUI (Text User Interface) mode. |
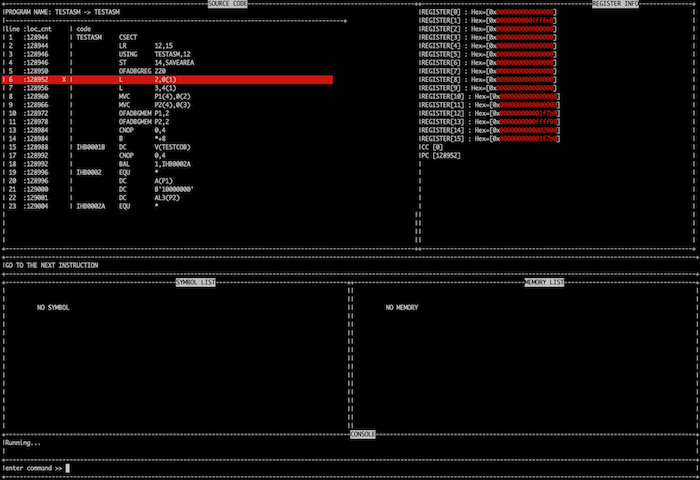
1.2. TUI (Text user interface) Mode
Switches to the user interface screen provided by ofadbg. This mode is activated by entering 'tui' at the console command prompt.
-
SOURCE CODE: Prints the code being traced and displays the running ASM programs sequentially.
-
REGISTER INFO: Prints the current values of registers R0 through R15, as well as the Condition code (CC) and Program counter (PC) values.
-
SYMBOL LIST: Prints the values of symbols registered in the value-tracking list.
-
MEMORY LIST: Prints the values of addresses registered in the value-tracking list.
-
CONSOLE: Displays the status and messages of the debug tool and provides a command input window.