This chapter describes the key features of SysMaster for WAS.
SysMaster for WAS queries statistics and error data for real-time WAS monitoring and data analysis.
WAS provider queries for WAS status related to services, invocations, resources, exceptions, VM, and host. It also prepares and queries for statistical data of active services and service data.
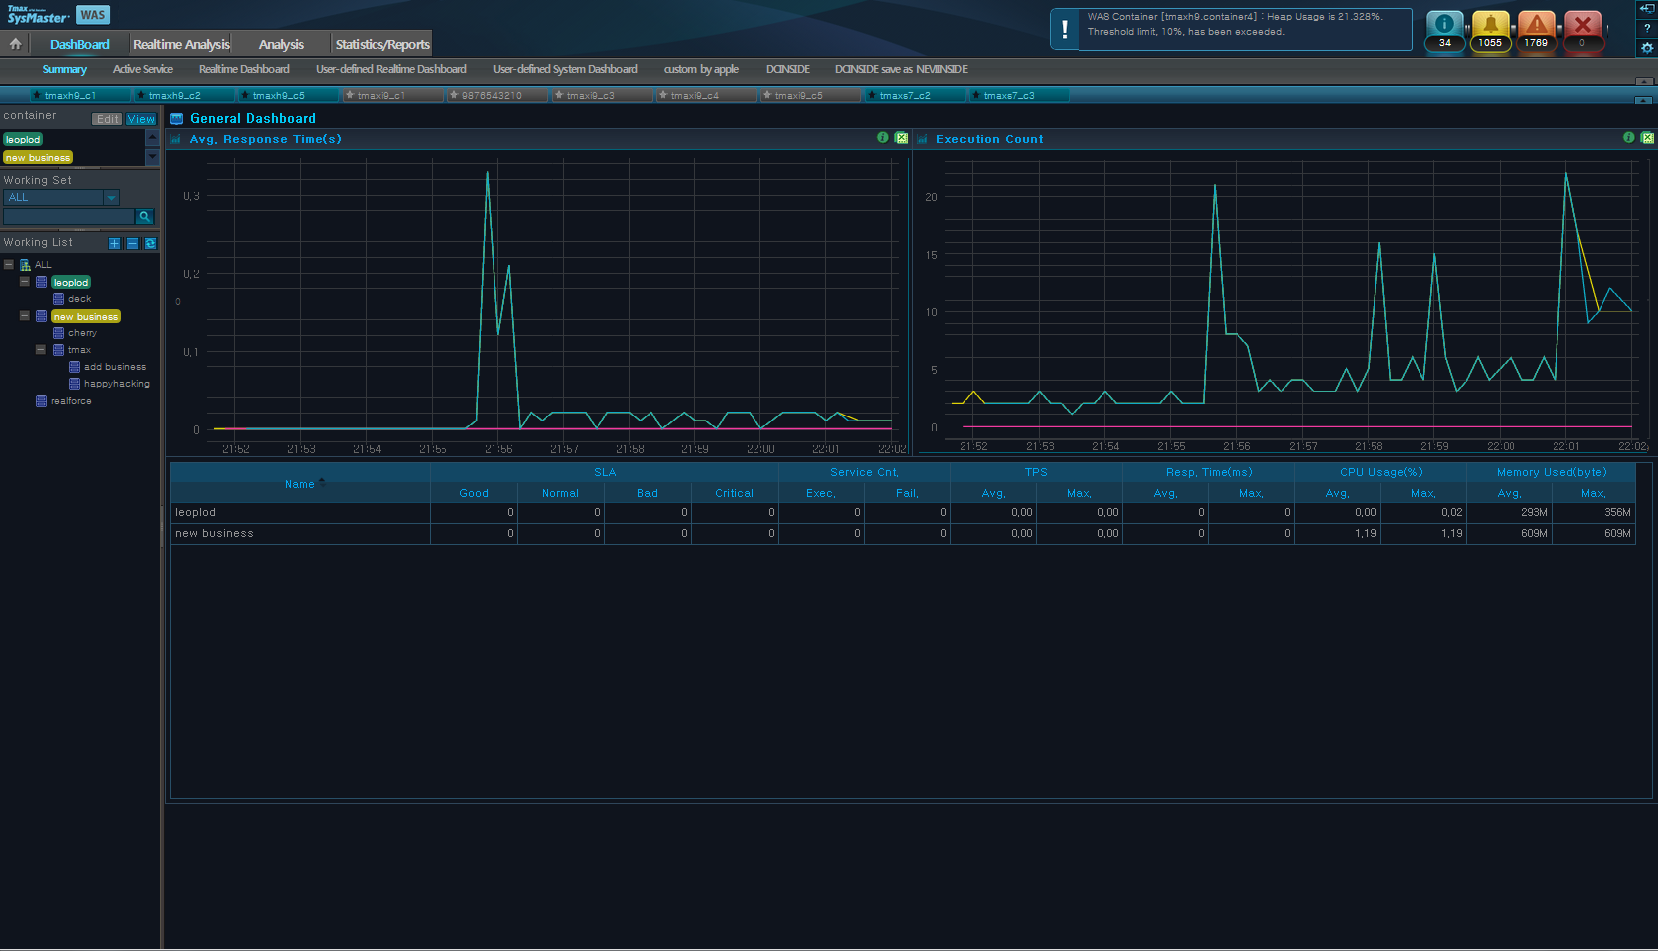
The following is an example of the [WAS] menu.
Note
Although SysMaster for WAS supports products like JEUS, WebLogic, WebSphere, etc., this guide uses TmaxSoft JEUS in its examples.
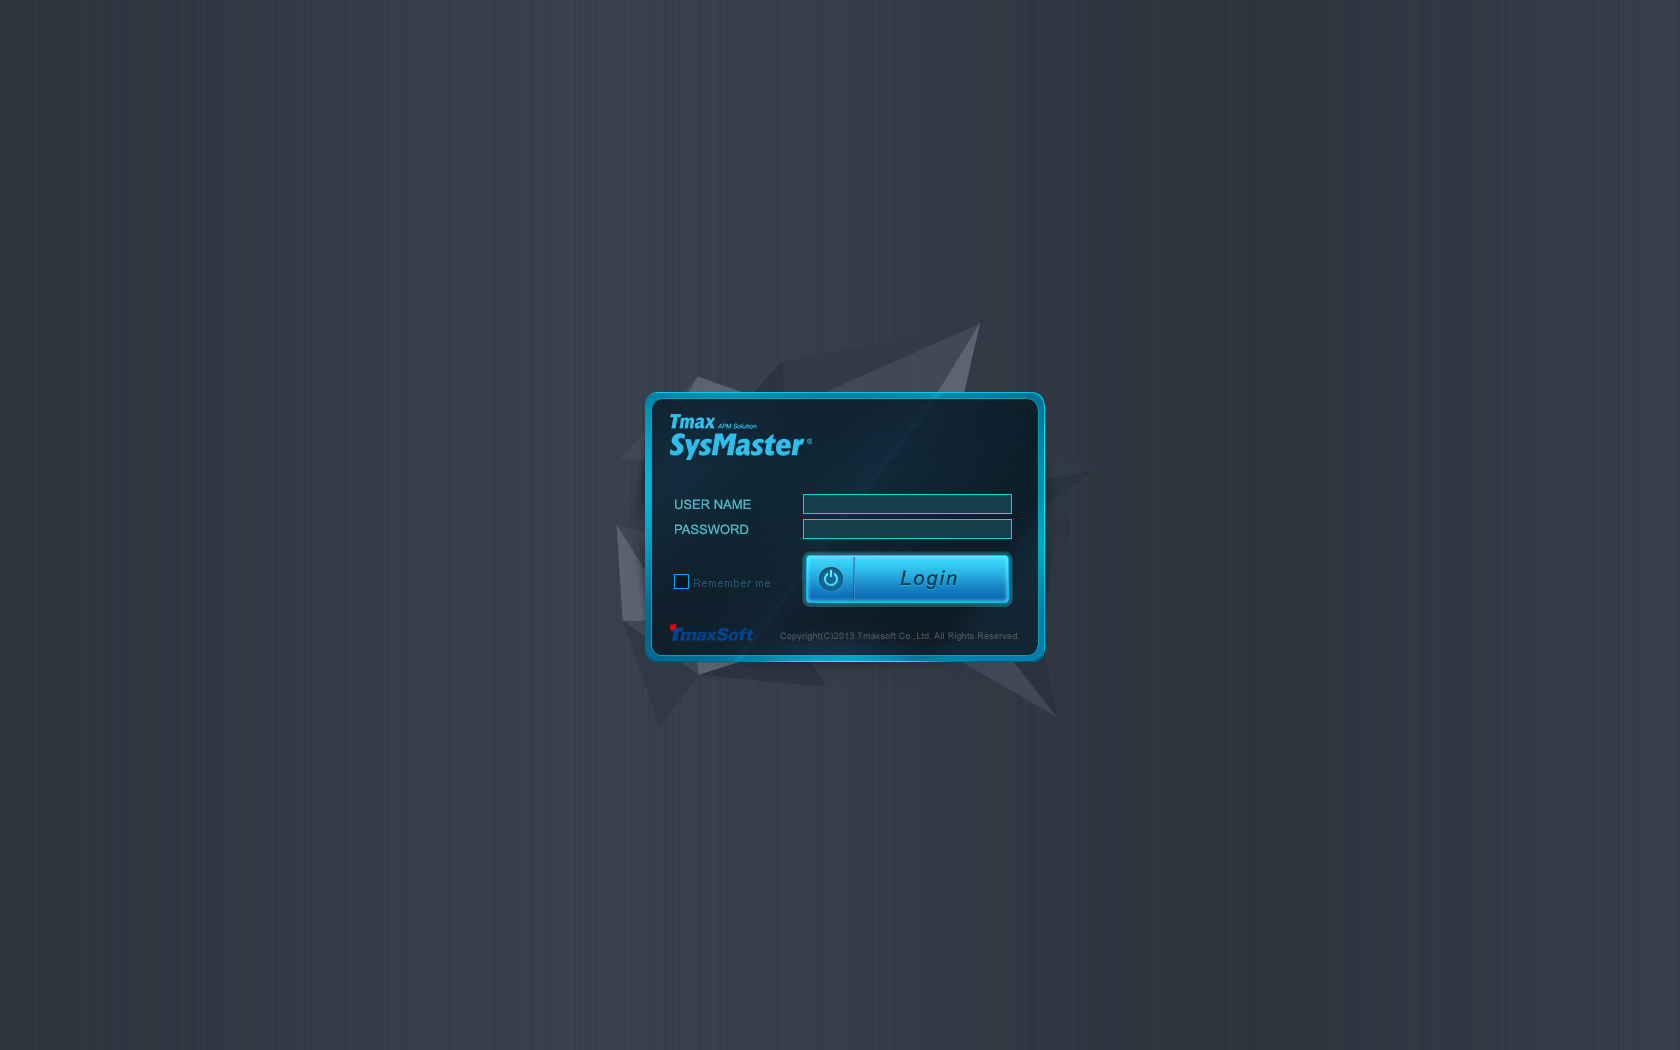
The following is SysMaster's login screen.
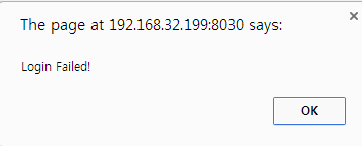
The user name and password can be saved by checking the [Remember me] checkbox. If an incorrect ID and/or password is entered, the following popup will appear.
SysMaster for WAS consists of four main menu items and their sub menus. Additionally, container shortcuts, event boxes, functions, and expand/collapse buttons are provided.
-
Dashboard
Provides real-time monitoring data for WAS and service-specific system data.
Menu Item Description [Summary] Checks for the status of a business through its average response time (s), execution count, and service information. [Active Service] Monitors and checks the container status of a business through the container's active service bar. [Real-Time Dashboard] Checks the hourly status and information of the container in real-time using container-specific active data of the user-interested indicators, Java virtual machine (JVM) data, user data, and throughput data of user-interested indicators through charts and tables. [User-defined Real-Time
Dashboard]
Provides more variety of indicators and data than the [Real-Time Dashboard].
Checks the container's status and information in real-time through charts and tables of active data, host data, java virtual machine(JVM) data, user data, transaction view data, throughput, and event data.
[User-defined System
Dashboard]
Checks the system indicators for each container instances.
Checks the node's system status and information in real-time through six chart types (CPU usage, memory usage, swap memory usage, disk usage, disk I/O, and network I/O).
[Custom Dashboard] The user creates a custom dashboard and checks for the desired indicators.
-
Real-Time Analysis
Provides detailed monitoring information about WAS. In general, when an error is detected from the dashboard, detailed error information can be obtained through real-time analysis of the error data.
Menu Item Description [Service(Active)] Checks real-time data for services, SQL, exceptions, and external transactions. [Snapshot] Checks real-time data for threads, class loaders, collection objects, file socket sessions, and environment variables. [Event] Checks current day's event status and event list.
-
Analysis
Provides periodic analysis data using charts and tables that can be used to analyze the periodic status of each container.
Menu Item Description [Summary] Displays periodic charts for JVM data, throughput, user data, service execution data, and error event charts. [TX View] Checks periodic distribution data for the current transaction. [Service] Checks periodic data for service, SQL, exceptions, and external transactions. [Infra] Checks periodic data for JVM, Java Pool, unclaimed resource, JNDI, and host. [Event] Displays periodic status, list, trend for event occurrences. [Visitors] Displays periodic user-related charts.
-
Statistics/Reports
Provides current trends and reports.
Menu Item Description [Top N Trends] Provides daily and monthly service trends. Shows the top 5 services in the sort order. [Relative Trends] Provides relative daily and monthly service trends of search indicators. [Report] Displays summary information, and general and business reports. -
Container Shortcut
A user-defined container can be assigned to a shortcut. The container shortcuts can be used to easily select and deselect frequently used containers. Up to 10 container shortcut buttons can be added.

The shortcut icon shows the active/inactive status of the container.
When the shortcut button is not selected, the star icon is black (
 ). When a shortcut is selected, the icon is
filled with a random color, and the container becomes selected in the
[Working List] and is added to the [Working Container].
). When a shortcut is selected, the icon is
filled with a random color, and the container becomes selected in the
[Working List] and is added to the [Working Container]. -
Event Box
Provides the current number of occurrences of each event type.

From the left, INFO, WARNING, ERROR, FATAL events are shown with the current day's cumulative total updated in real-time. The totals are reset every 24 hours. When an event icon is clicked, the screen will go to the [Real-Time Analysis] > [Event] screen.
-
Action Buttons
The buttons on the top right of the screen consists of Log Out (
 ), Help (
 ), and SysMaster Admin Settings
(
), and SysMaster Admin Settings
( ) buttons.
 -
Expand/Collapse Buttons
The main menu and container shortcut menu can be hidden using the

 buttons to expand the area for charts or
tables. Re-click the button to restore the menu.
buttons to expand the area for charts or
tables. Re-click the button to restore the menu.
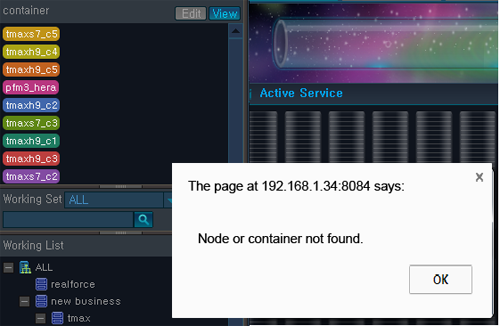
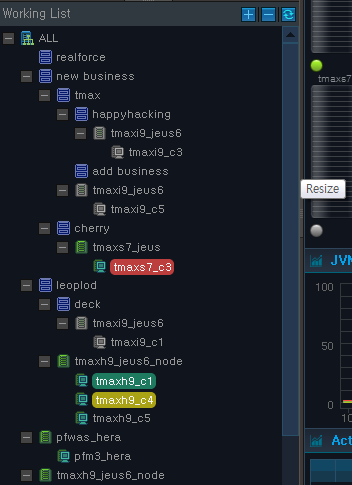
Working List is a list of nodes and containers. WAS component tree is the starting point of WAS service and system monitoring where the containers of nodes can be selected for monitoring. The nodes of the tree are made up of business systems configured with SysMaster, and all registered WAS nodes and J2EE containers.
When a level (a node of a container) is selected from the Working List, the container is also added to the Working Container and is used in the search with the existing containers. Working List can include one or more resources depending on the screen. Up to 10 multiple selections are allowed. Selected resources are shown in different colors and are added to the Working Container list on the top. All data charts and tables on all WAS screens are for the selected node(s) of the tree.
The Working List is used in the Edit or View mode. View is the default mode. A container can be selected or deselected in the View mode. In the Edit mode, container shortcuts and items in the Working Set can be added, modified, or deleted.
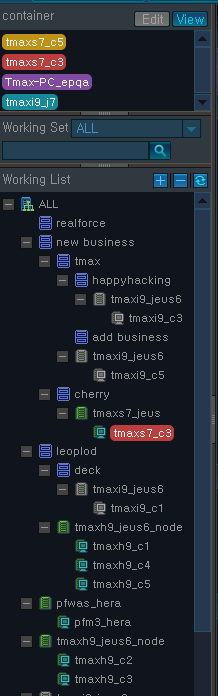
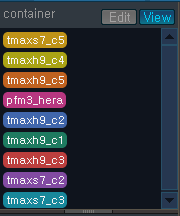
The following shows the Working List that is used to check the status of each container and node.
-
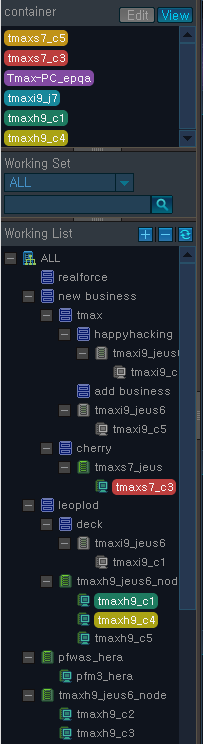
Working Container
Shows the list of containers that are selected in the Working List. It can be used to easily check the containers selected for monitoring. A selected container can be deselected from either the Working List or Working Container.
If multiple containers are selected from the Working List, they are each displayed in different colors and are shown on the charts in the corresponding colors.
-
Working Set
The Working Set can be used to group registered businesses, nodes, and containers to perform a separate search when there are too many in the Working List. Working Set is set to ALL by default. Change to the Edit mode to add, edit, or delete to/from the set.
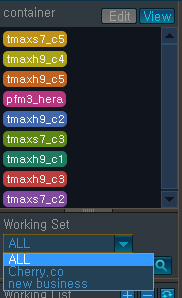
To add a new Working Set, select 'ALL' from the dropdown list, and then select 'ALL' from the top of the Working List tree to see the [Create Working Set] menu item.
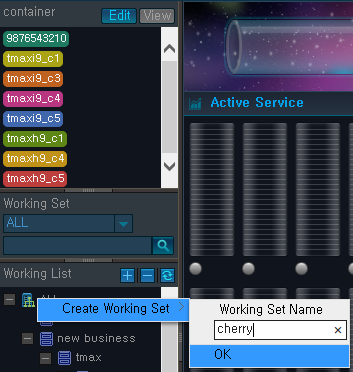
Select the desired business, nodes, and containers from the Working List to assign them to the Working Set.
A business that has no nodes or containers cannot be added to a Working Set.
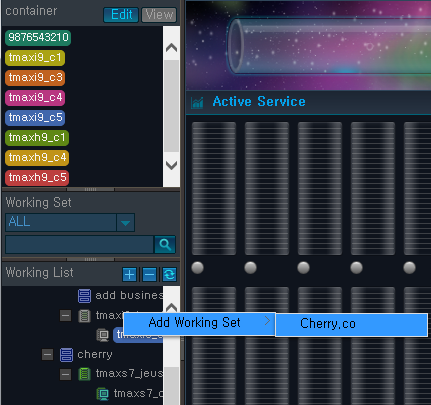
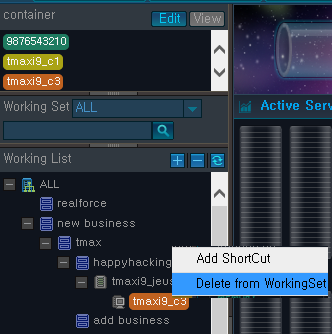
To delete from the Working Set, select the Working Set to delete and then select a business, node, or container from the Working List to delete as shown in the following.
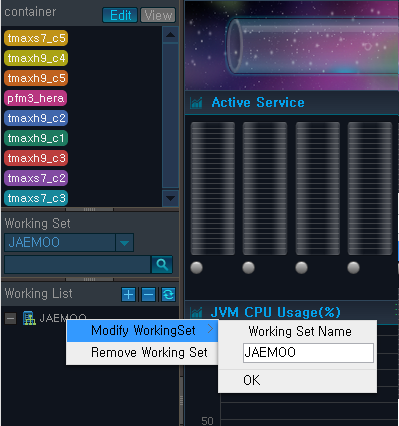
In the following screen, the 'JAEMOO' business from the Working Set is selected. Then the top node (JAEMOO) from the Working List is selected, and the menu items for modifying the set name and deleting the set are shown.
To search for businesses, nodes, and/or containers, enter a search text and then click
 . The application, node, and container names
that include the search text become italicized in the Working
List.
. The application, node, and container names
that include the search text become italicized in the Working
List.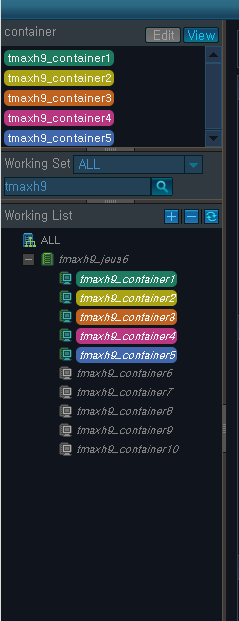
All the names may not become italicized. The user can Resize the Working List to increase the width.
-
Working List
The hierarchy of the Working List tree structure is [Business] > [Node] > [Container].
Depending on the characteristics of the menu item, only one or multiple nodes and containers can be selected. They are displayed in different colors and added to the Working Container. A selected container can be deselected, and it can be re-selected from the Working List.
The following is description of icons used in the Working List.
Icon Description 
Root of the Working Set tree. Labeled with the working set name. 
Business system.  (Gray) /
  (Green)
Icon is Gray if Agent is NOT running, and green if Agent is running.  (Gray) /
  (Green)
Container status. Same as icon. Green = Running, Gray = Not Running 
Expand the entire tree. 
Close all the nodes except for the root business node. 
Reset the tree. 
Expand all the nodes below the current node. 
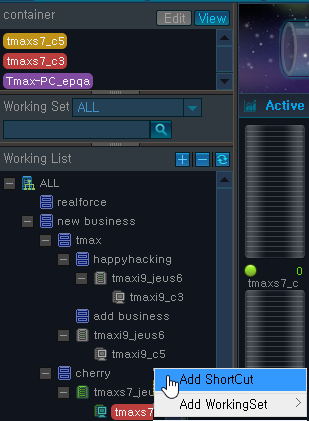
Close all the nodes below the current node. If Working List is in the Edit mode, select and right click on the container, and then click [Add Shortcut] to add a container shortcut.
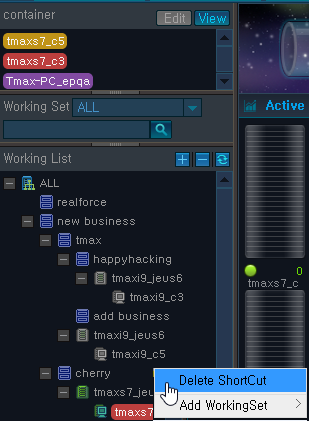
To delete an existing shortcut button for the container, select and right click on the container, and then click [Delete ShortCut].
Using the mouse, hover over a tree node to view information about the business, node, or container.
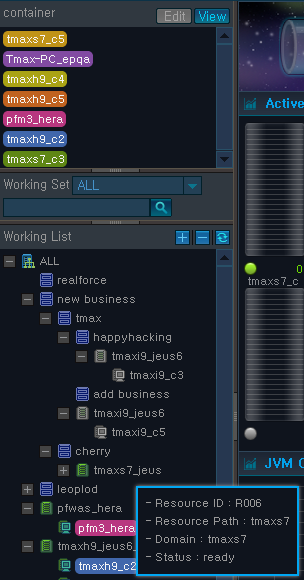
Property Description Resource ID ID automatically assigned to a resource that is added during the registration of a monitoring target. The Agent is first registered and then the resource is registered to the Agent. Resource Path Path of the node's resource. Domain Domain information of the target host. Status One of ready, not ready, and unknown. Can only perform monitoring in the ready state. -
Folding Button
The Working Container and Working Set can be hidden using the folding
 buttons in the Working List to expand its area.
Re-click on the folding buttons to make them appear again.
buttons in the Working List to expand its area.
Re-click on the folding buttons to make them appear again. button can be used to hide the Working List and
expand the dashboard area where charts and tables are displayed.
Re-click on the button to make it appear again.
button can be used to hide the Working List and
expand the dashboard area where charts and tables are displayed.
Re-click on the button to make it appear again.
Provides various functions related to the currently used charts and tables.
-
Displaying Chart Value
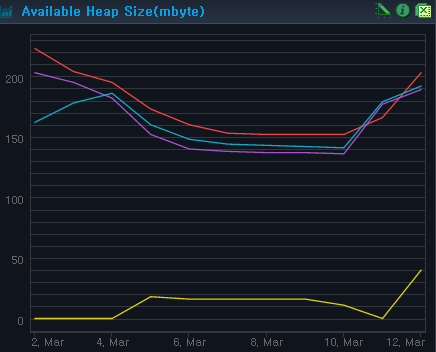
Hover over the chart with the mouse to see the value displayed.
-
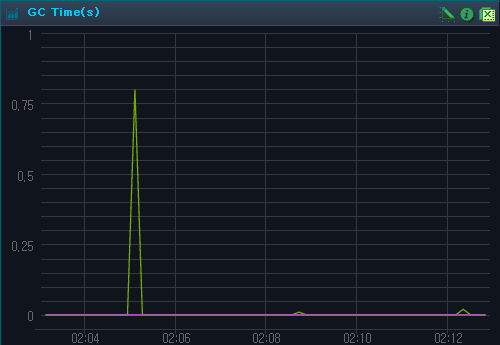
Setting Max. Value of Y Axis
 Click on this icon to set the max value of the
Y axis.
Click on this icon to set the max value of the
Y axis.
The max value of the Y axis is set to 1 in the following.
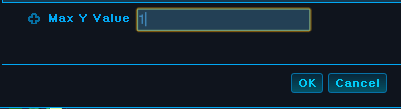
The chart shows max value of the Y axis as 1. To reset the value, clear the textbox and then click [OK].
-
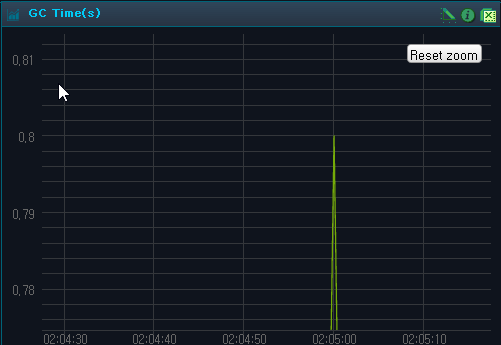
Drag & Drop on the Chart
Drag & drop on the chart to zoom in on a chart area. This function applies to all charts, but the zoom out function is not provided. Click [Reset Zoom] to reset the chart.
-
Getting Help
 Click on this icon to see a popup window with
detailed information about a chart or table.
Click on this icon to see a popup window with
detailed information about a chart or table.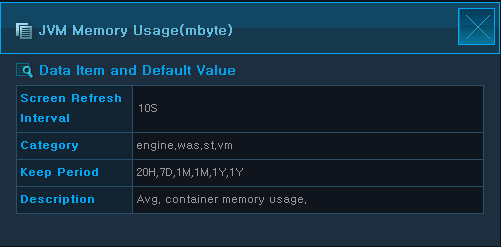
-
Zooming in on Chart
 Click on this icon to see an enlarged view of
the chart in a popup window.
Click on this icon to see an enlarged view of
the chart in a popup window.
-
Saving Chart/Table to Excel
 Click on this icon to save a chart or table to
an excel file.
Click on this icon to save a chart or table to
an excel file.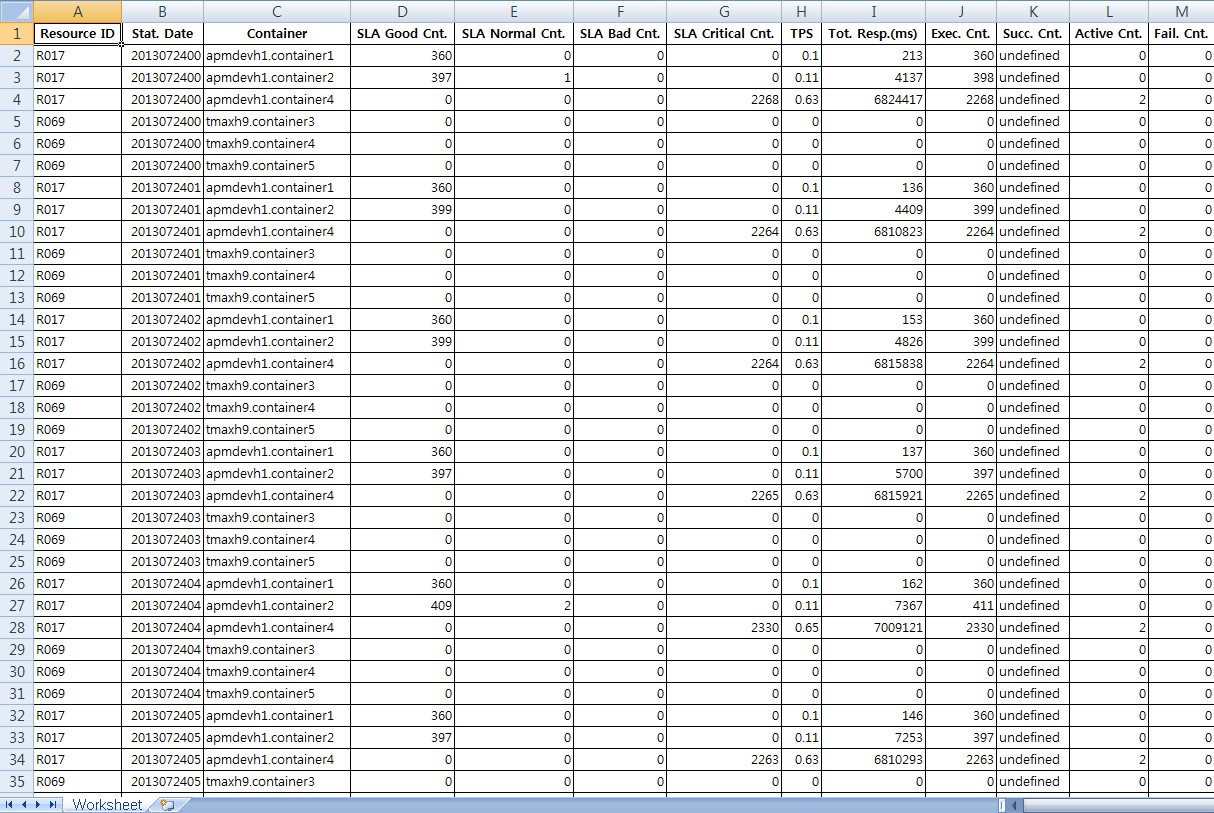
-
Selecting Chart Legend Variables
A user can select the variables for the chart legend. By default, all variables of the legend are displayed on the chart. Select the ones to exclude, and they will appear in white. Reselect the excluded variables to add them back on the chart.
The following is an example of selecting legend variables.
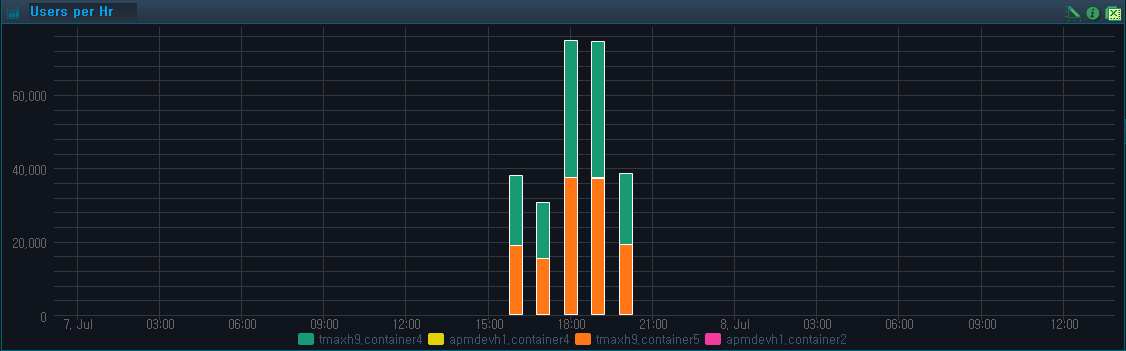
![Selecting Legend Variables - [Excluding tmax9.container5 and apmdevh1.container2]](resources/chap1/intro_4_15.png)