Table of Contents
This chapter describes how to search for real-time monitoring target data and servers.
The Dashboard displays real-time monitoring data and system data for WAS. It provides real-time data for the selected resources for the most recent 10 minute interval. Active properties and transaction view are refreshed every 2 seconds and the rest every 10 seconds.
Dashboard can be accessed from [WAS] > [Dashboard].
Dashboard Menu consists of the following two items.
-
Working List
Multiple businesses, nodes, and containers can be selected from the Working List. For more detailed information, refer to "1.4. Working List".
-
Monitoring
Data is displayed in charts and using a summary table by business and instance for each of the following sub menus.
Menu Item Description [Summary] Checks the status of business through its average response time (s), execution count, and service information. [Active Service] Monitors and checks the container status of a business using the container's active service bar. [Real-Time Dashboard] Checks the hourly status and information of a container in real-time using container-specific active data for user-interested indicators, JVM data, user data, and throughput data using charts and tables. [User-defined Real-Time
Dashboard]
Provides more variety of indicators and data than the [Real-Time Dashboard].
Checks the container's status and information in real-time using charts and tables of active data, host data, JVM data, user data, transaction view data, throughput, and event data.
[User-defined System
Dashboard]
Checks the system indicators for each container instances.
Checks the node's system status and information in real-time using six different chart types (CPU usage, memory usage, swap memory usage, disk usage, disk I/O, and network I/O).
[Custom Dashboard] The user creates a custom dashboard and checks for the desired indicators.
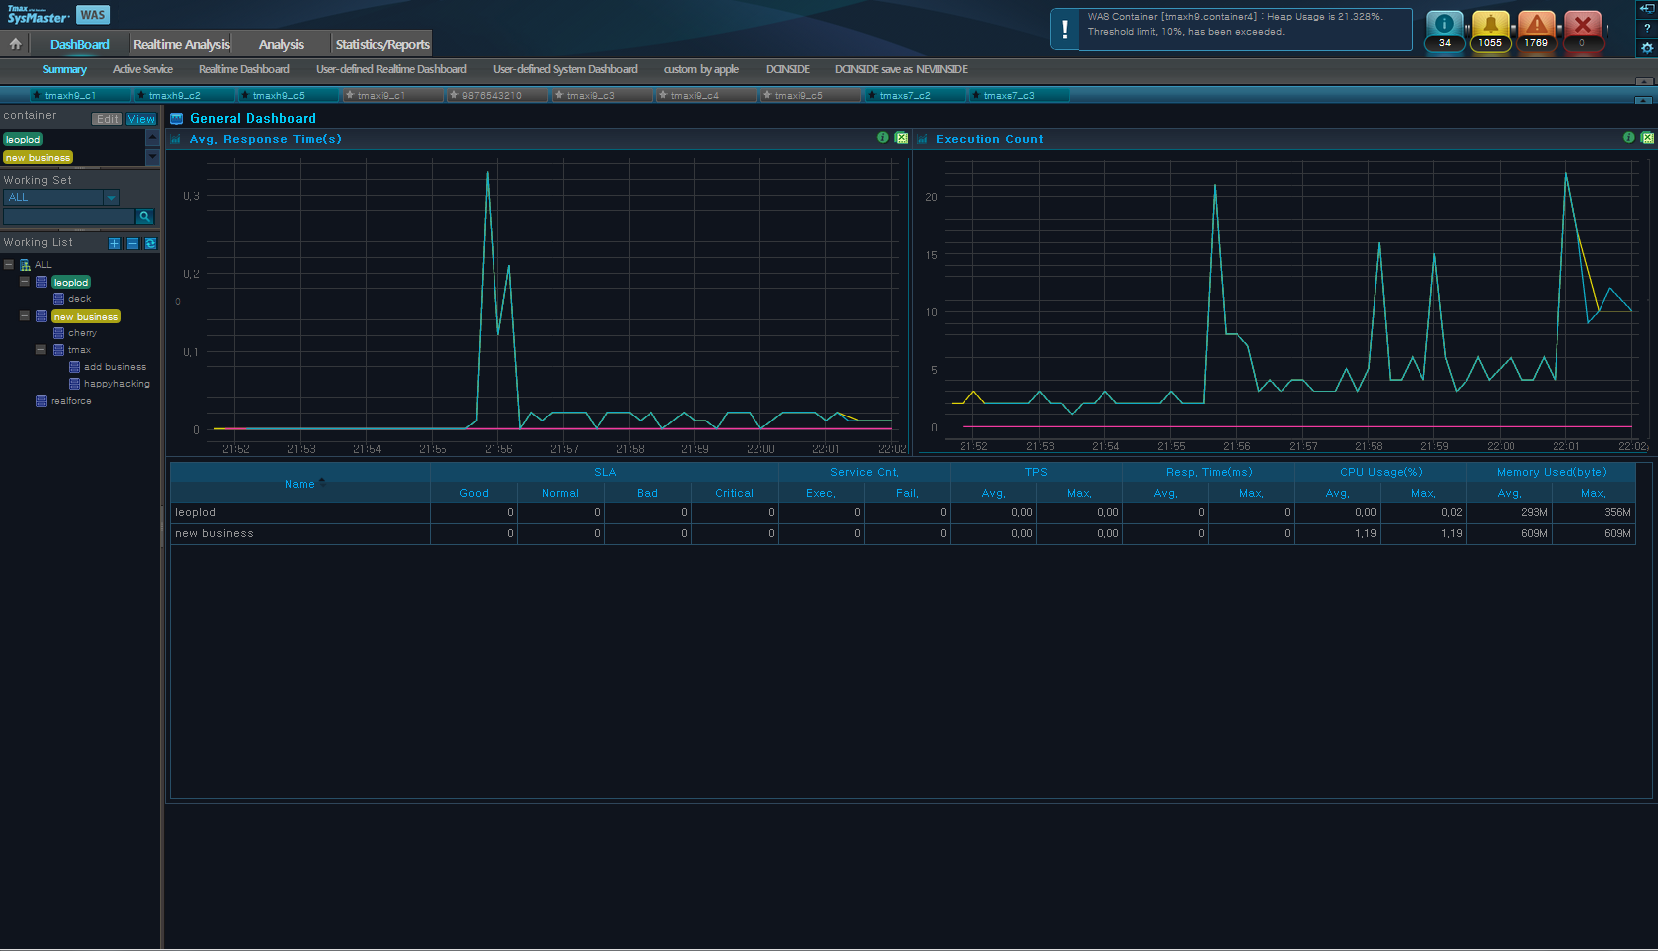
Summary can be viewed by selecting a business from the Working List, and one or more businesses can be selected. The color of the selected business matches that of the Color Table. The data for the selected business is displayed on the average response time chart, execution count chart, and data table. Summary is refreshed every 10 seconds.
Summary can be accessed from [WAS] > [Dashboard] > [Summary].
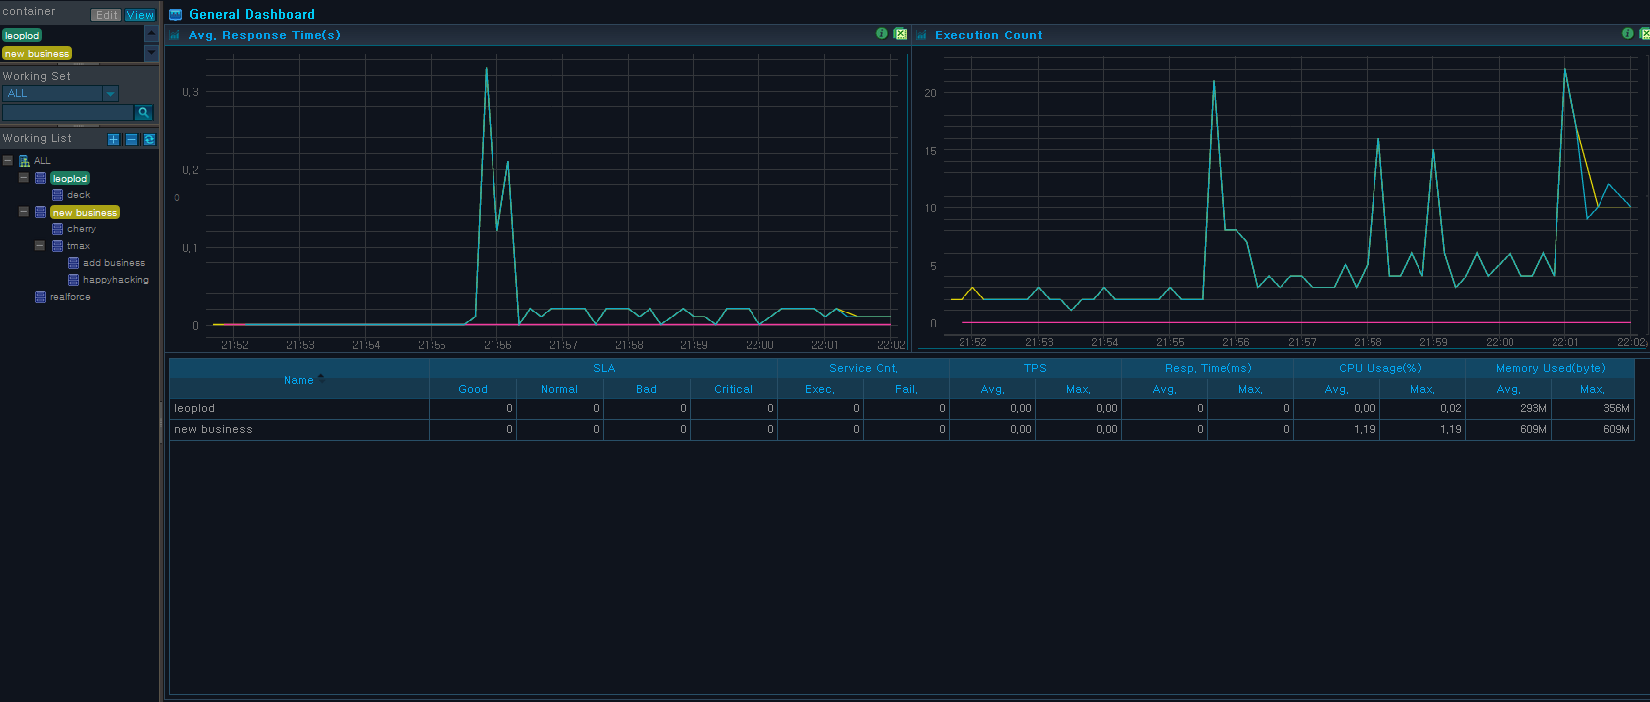
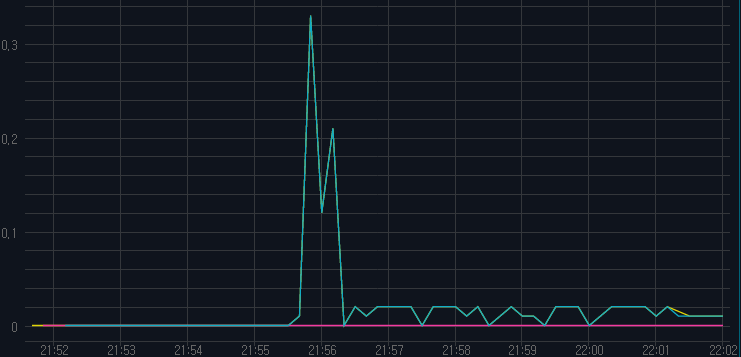
Avg. Response Time(s)
Displays a chart of average response times for the selected businesses.
Avg. Response Time(s) chart can be used to compare the response times of multiple businesses, and detect and handle issues for businesses with long response times. The X axis shows the most recent 10 minute period, and the Y axis shows the avg. response time(s).
Execution Count
Displays a chart of execution counts for the selected businesses.
The Execution Count chart can be used to compare and monitor the throughput data of multiple businesses.
General Table by Business
Displays a table of various data for each business. For information about defining a business and configuring SLA (Service Level Agreement) threshold, refer to "SysMaster Administrator Guide".

| Property | Description |
|---|---|
| SLA Good | Number of services with Good response time according to SLA. (Response Time, between 0 ~ 1000ms) |
| SLA Normal | Number of services with Normal response time according to SLA. (Response Time, between 1000 ~ 3000ms) |
| SLA Bad | Number of services with Bad response time according to SLA. (Response Time, between 3000 ~ 5000ms) |
| SLA Critical | Number of services with Critical response time according to SLA. (Response Time, more than 5000ms) |
| Exec. Service Cnt. | Service execution count. (Successes + failures) |
| Fail. Service Cnt. | Number of failed services. |
| Avg. TPS | Average number of services processed per second. |
| Max. TPS | Maximum number of services processed per second. |
| Avg. Resp. Time (ms) | Average service response time. |
| Max Resp. Time | Max service response time. |
| Avg. CPU Usage(%) | CPU usage. |
| Max CPU Usage(%) | Max CPU usage. |
| Avg. Memory Used(byte) | Memory usage. |
| Max. Memory Used(byte) | Max memory usage. |
Active Service is refreshed every 2 seconds, and containers are displayed in the units of business.
Active Service can be accessed from [WAS] > [Dashboard] > [Active Service].
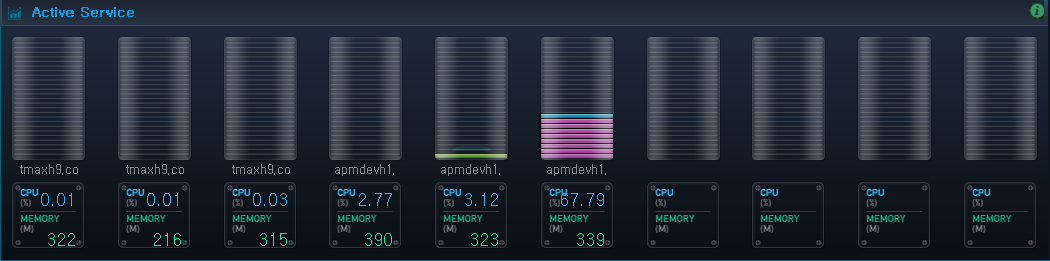
The Active Service Bar dynamically represents real-time data for each container grouped by business.
Active properties provide data for currently running services, such as EJB, Servlet, etc. Basic information including Container Name, CPU Usage(%), and Memory(M) are displayed. The number of running services in each container is displayed with an active bar. Different colors are used to distinguish services with different execution times.
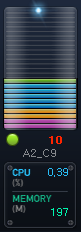
| Classification | Description |
|---|---|
| Active Bar | Displays the status of the container process with the color according to the execution time.
|
| Number | Number of active bars. The color displayed represents the service with the longest execution time. |
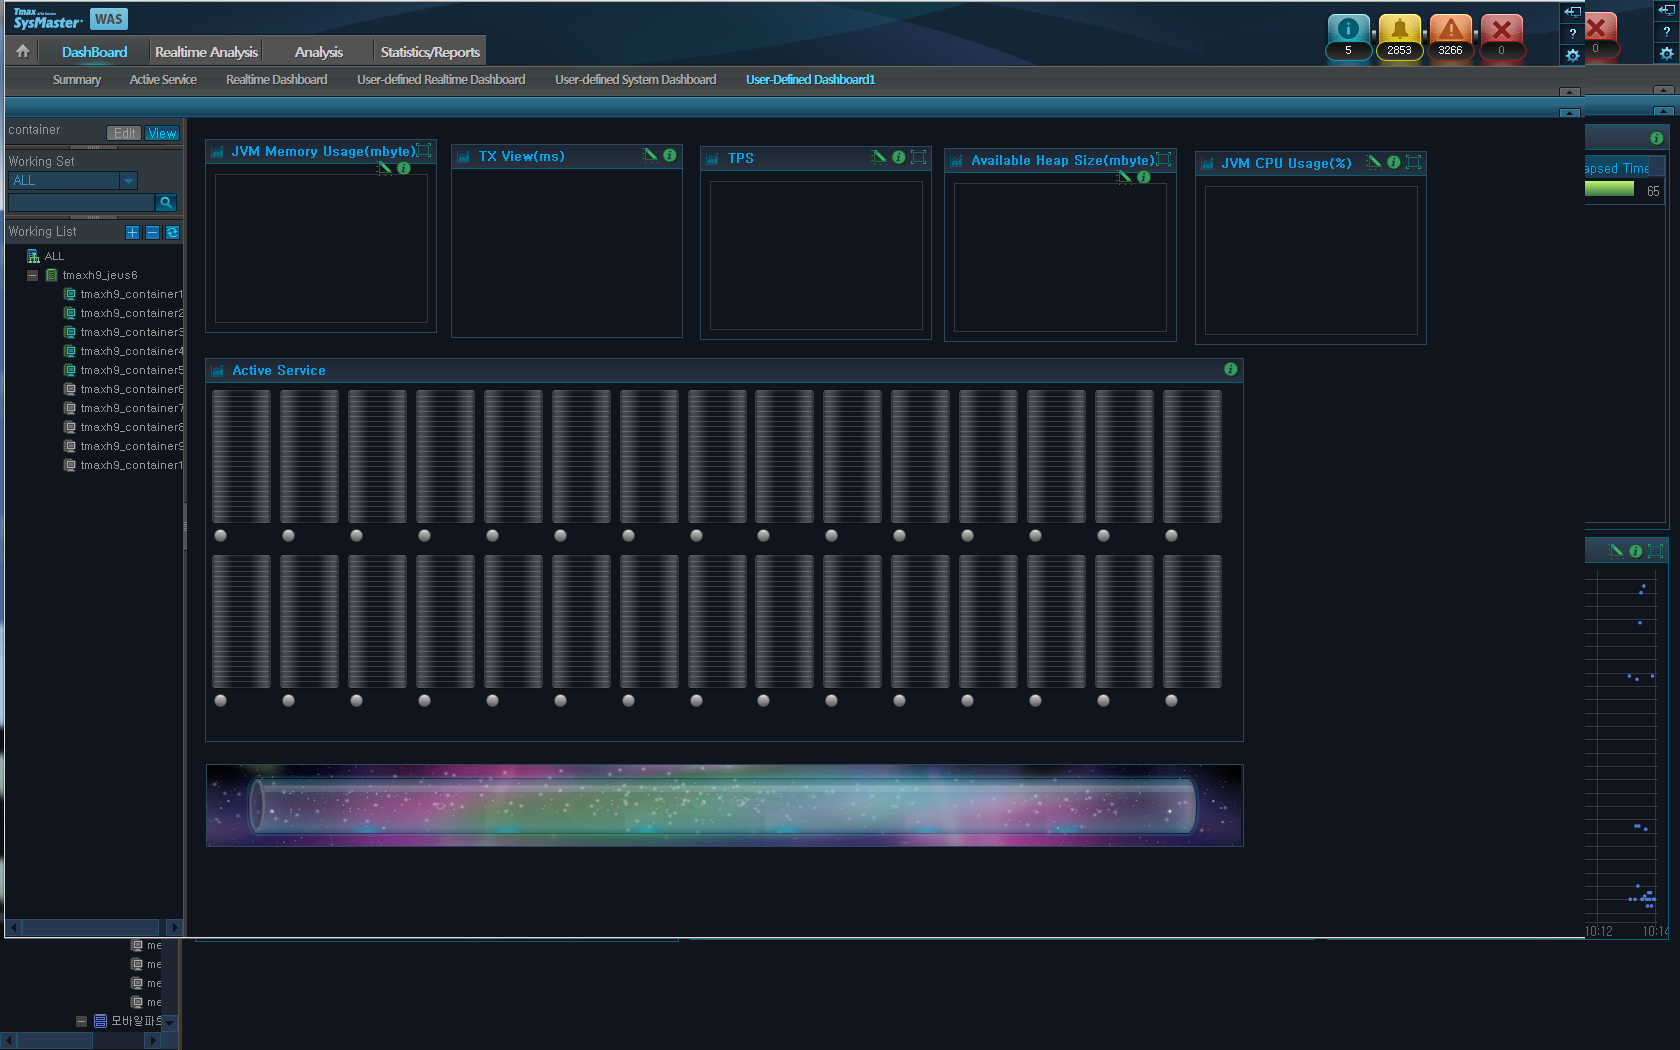
Real-time dashboard displays Active Data, JVM Data, User Data, and Throughput Data in charts and tables for monitoring purposes.
Real-time dashboard can be accessed from [WAS] > [Dashboard] > [Real-Time Dashboard].
Active Data
Active charts and tables are refreshed every 2 seconds.
-
Active Speed Bar
Space theme is used as a background with a planet (
 ) representing a running transaction that moves
from the left to the right. The number of planets increases
proportionally to the number of transactions.
) representing a running transaction that moves
from the left to the right. The number of planets increases
proportionally to the number of transactions.For each selected container, a number of disks proportional to the total number of running services are accumulated starting from the right end of the cylinder. Up to 80 transactions are displayed in descending order of service execution time.
-
Active Service Bar
Active services are shown as containers starting from the left in the order they were selected by the user. Up to 30 containers can be displayed. For more information, refer to "2.3. Active Service".
-
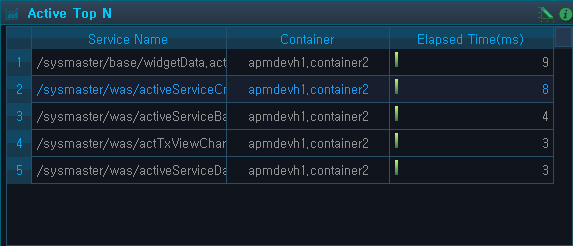
Active Top N
List of selected containers' active services are displayed in the order of increasing execution time. Up to 20 services can be listed for each container.
Property Description Service Name Request name that identifies the service. (JSP URL, EJB Method, etc.) Container Information about the container where the transaction originated from. Elapsed Time(ms) Service processing duration.
Since Top N is refreshed every two seconds starting from when the user makes a request from a browser, different Elapsed Time(ms) can be displayed for different users within a two second interval.
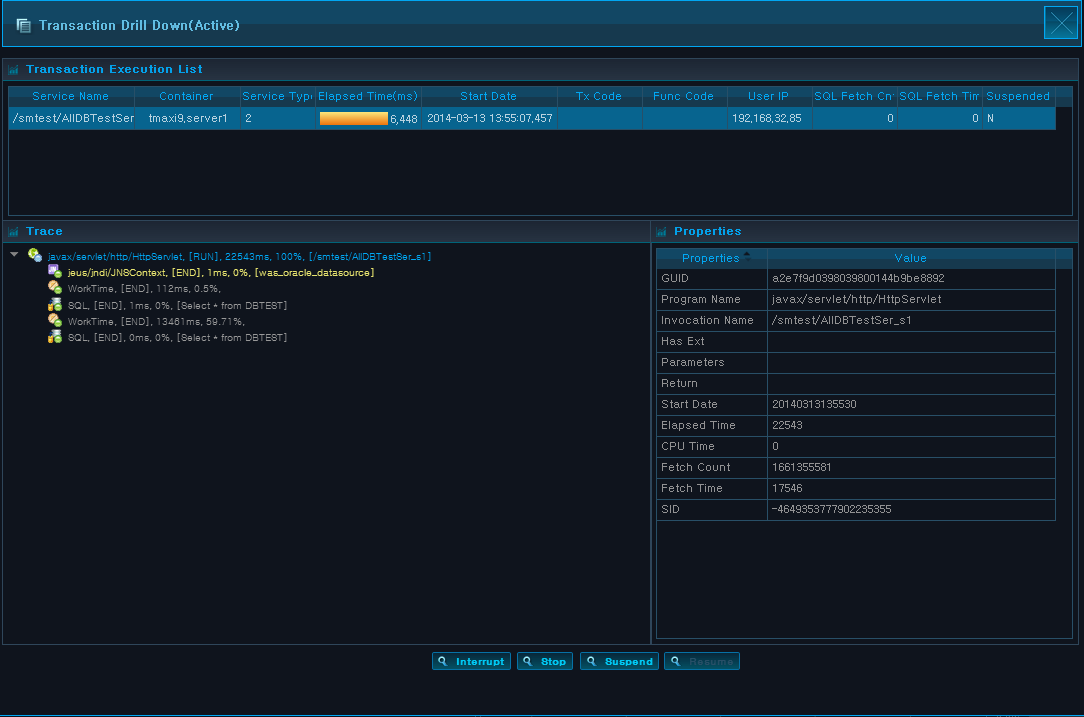
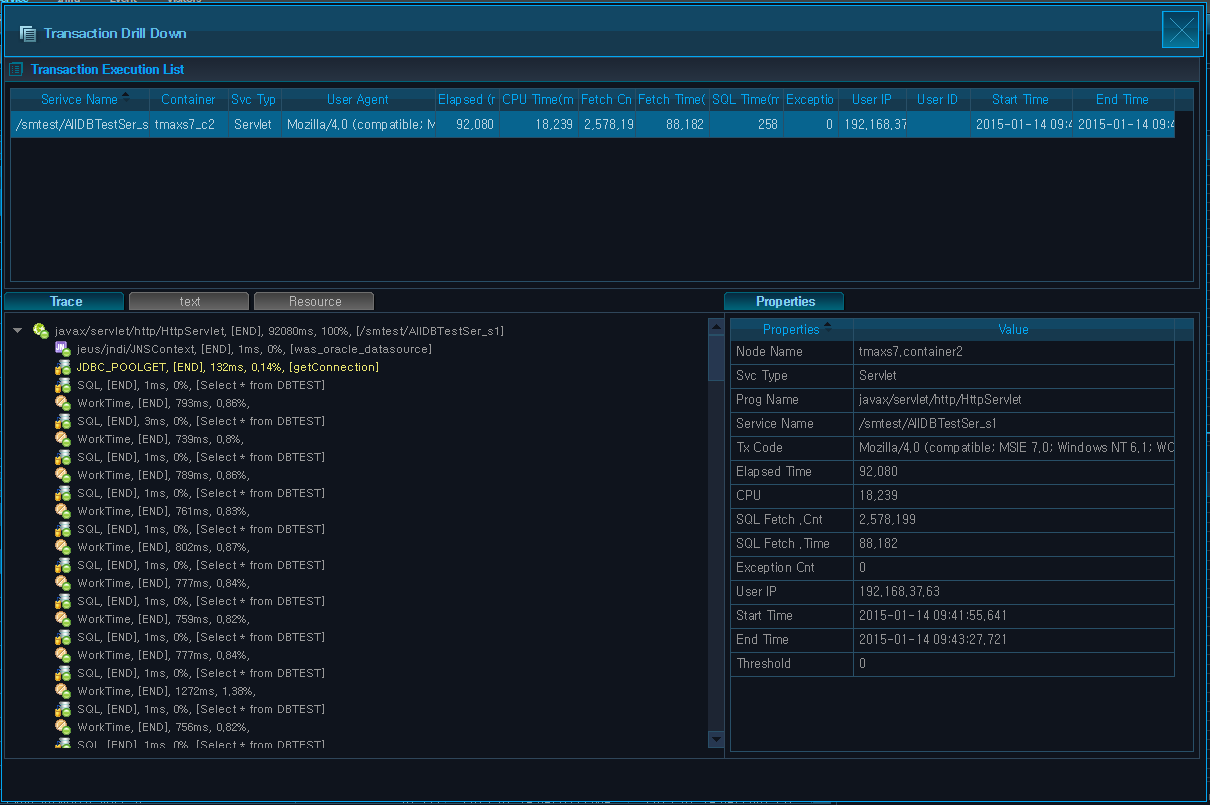
Detailed transaction information can be viewed on a popup window by selecting a service row. Basic transaction information and resource are shown on the top, and transaction trace and trace properties are shown on the bottom.
-
Transaction Execution List
The following is description of the properties.
Property Description Service Name Request name that identifies the service. (JSP URL, EJB Method, etc.) Container Information about the container where the transaction originated from. Service Type Transaction service type.
(user, servlet, JDBC, TP(external transaction), JNDI, EJB, Header, etc.)
Elapsed Time(ms) Service processing duration.
Elapsed Time value in Transaction Execution List can be different from that in the Trace tree. Data in Transaction Execution List is retrieved when user clicks on the parent screen, and data in the Trace tree is retrieved when user clicks a row in Transaction Execution List.
Start Date Service start date and time. Tx Code User-defined transaction code recorded in the service. User IP IP address of the user who made the service request. SQL Fetch Cnt. Number of DB fetches recorded in the service. SQL Fetch Time (ms) Total DB fetch processing time recorded in the service. Suspended Enable starting and stopping of server processes? (Y/N) -
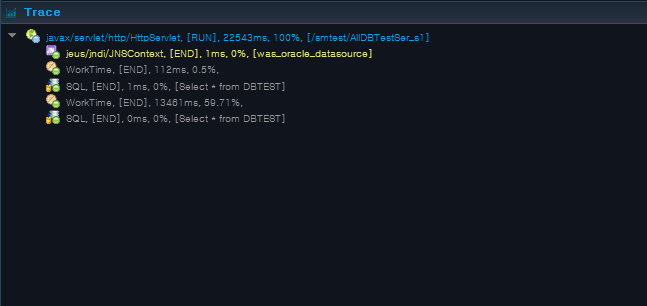
Trace
The trace tree can be accessed from the Trace Menu. Each trace consists of the Program Name, Status, Execution Time,% Occupied, and Service Name.
-
Properties
Select a service from the transaction execution list to see the General Properties table, and select a trace to see the Detailed Properties table.
-
General Properties
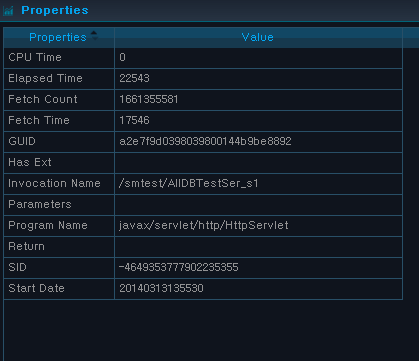
The following is description of the general properties.
Property Description GUID Transaction ID for J2EE container. Program Name Invoked program name. (Servlet class name, EJB class name, etc.) Invocation Name Calling name of the Invocation. Has Ext Enable saving SQL full text. Parameters Configured parameters for Invocation call. Return Configured return value for Invocation call. Start Date Service start time. Elapsed Time Service processing duration. CPU Time Average CPU time used by the service. Fetch Count SQL Fetch execution count. Fetch Time SQL Fetch execution duration. SID Unique ID for DB instance. -
Detailed Properties
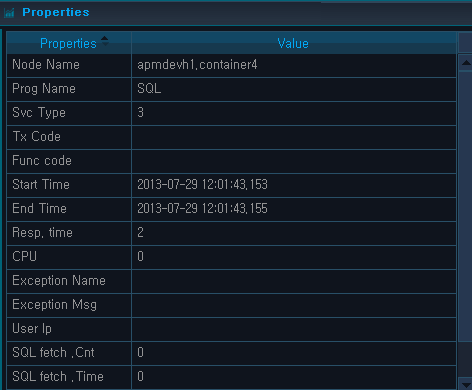
The following is description of the detailed properties.
Property Description Node Name Node name of the service. Svc Type Transaction service type.
(user, servlet, JDBC, TP(external transaction), JNDI, EJB, Header, etc.)
Prog Name Invoked program name. (Servlet class name, EJB class name, etc.) Service Name Request name that identifies the service. (JSP URL, EJB Method, etc.) sql Executed SQL query. CPU Average CPU time used by the service. Start Time Service start time. End Time Service termination time. Resp. Time Average service response time. Exception Name Name of the exception that occurred in the service. Exception Msg Exception message that occurred in the service. User IP IP address of the user who requested the service. SQL fetch .Cnt SQL Fetch execution count. SQL fetch .Time SQL Fetch execution duration. Param Configured parameters for Invocation call.
-
-
Service Control Buttons
The following is description of service control buttons.
Button Description [Interrupt] Interrupt currently running service. [Stop] Forcibly terminate currently running service. [Suspend] Suspend currently running service. [Resume] Resume service.
-

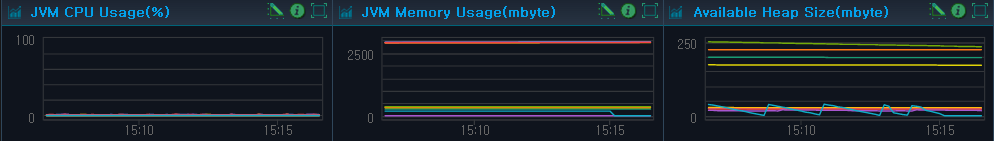
Java Virtual Machine (JVM) Data
JVM data is refreshed every 10 seconds, and is displayed as follows.
| Chart | Description |
|---|---|
| JVM CPU Usage (%) | JVM CPU usage of the container selected in the Working List. Data is refreshed every 10 seconds. (X axis: Most recent 10 minute period, Y axis: JVM CPU Usage(%)) |
| JVM Memory Usage (mbyte) | JVM memory usage of the container selected in the Working List. Data is refreshed every 10 seconds. (X axis: Most recent 10 minute period, Y axis: JVM Memory Usage (MB)) |
| Available Heap Size (mbyte) | Available JVM heap memory size of the container selected in the Working List. Data is refreshed every 10 seconds. (X axis: Most recent 10 minute period, Y axis: Available heap size (MB)) |
User Data
The number of concurrent users is refreshed every 10 seconds, and real-time data is displayed as in the following. (X axis: Most recent 10 minute period, Y axis: Concurrent user count)
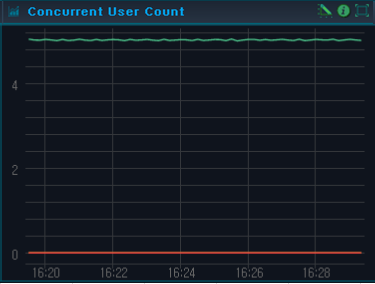
Since HTTP protocol does not maintain connections with users, the following equation based on the performance theory is used to determine the number of concurrent users.
ConcurrentUser = Throughput(tps) * {Resp.Time(sec) + ThinkTime(sec)}The accuracy of the previous equation increases with increased load.
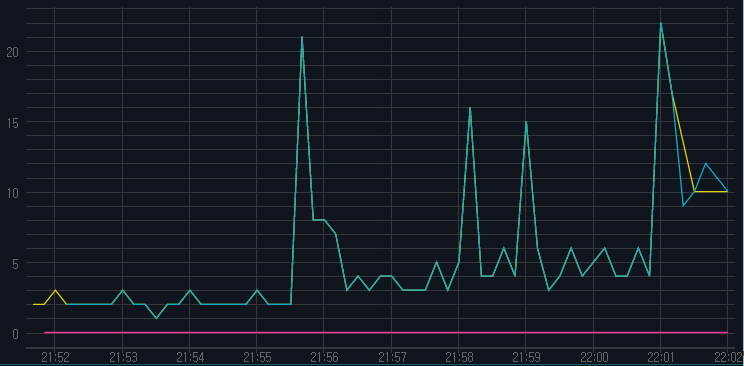
Transaction View Data
Transaction View Data displays transactions processed per unit of time (ms) using scatter plot to show distribution of the currently executing transaction. TX View is refreshed every 2 seconds.
(X axis: Most recent 10 minute period, Y axis: response time(ms))
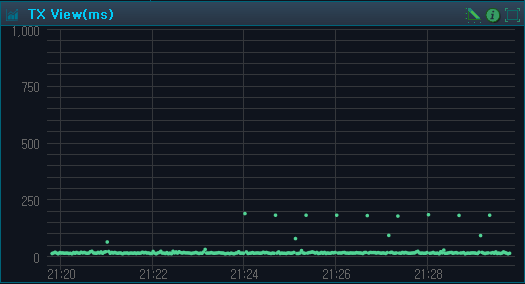
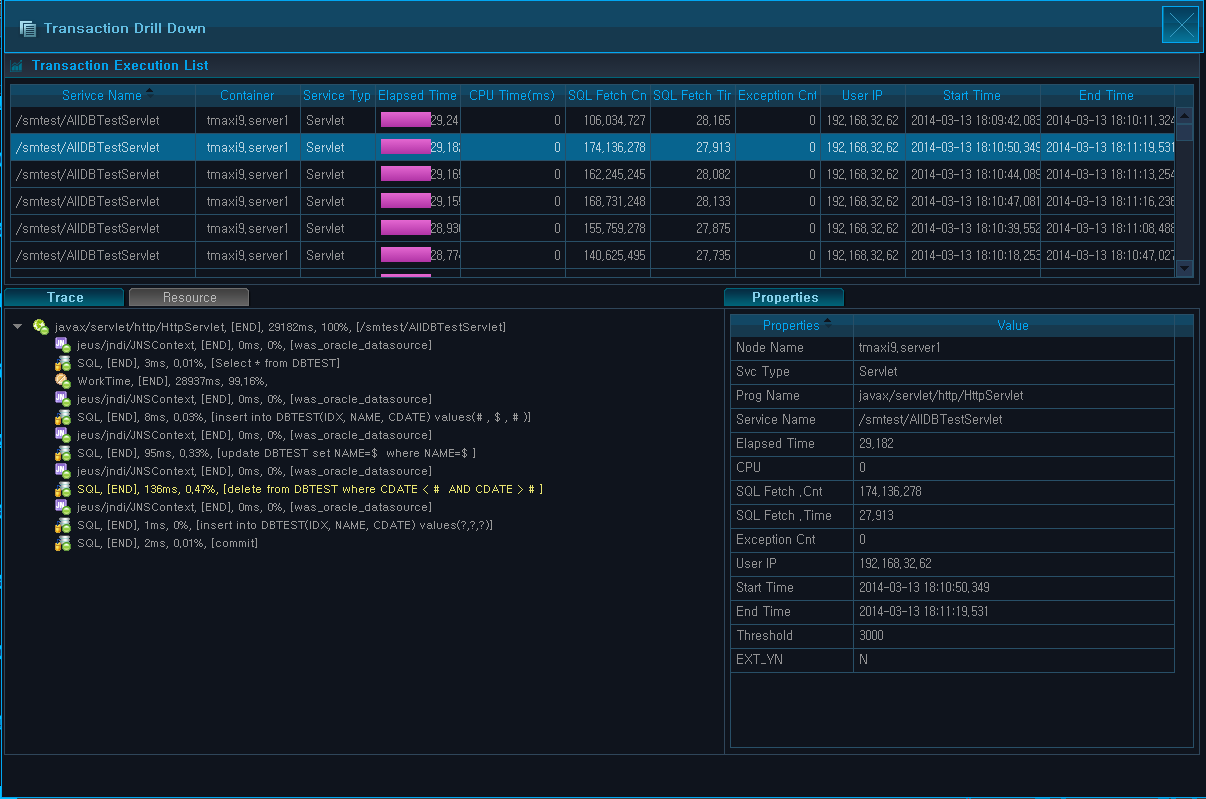
To view more detailed transaction information, use Drag & Drop method to select the area and view detailed information on a popup window. Basic transaction information and resource are displayed on the top, and transaction trace and trace properties are shown on the bottom.
-
Transaction Execution List
The following is description of the transaction execution list properties.
Property Description Service Name Request name that identifies the service. (JSP URL, EJB Method, etc.) Container Information about the container where the transaction originated from. Service Type Transaction service type.
(user, servlet, JDBC, TP(external transaction), JNDI, EJB, Header, etc.)
Elapsed Time Duration for service processing.
Elapsed Time value in Transaction Execution List can be different from that in the Trace tree. Data in Transaction Execution List is retrieved when user clicks on the parent screen, and data in the Trace tree is retrieved when user clicks a row in Transaction Execution List.
CPU Time (ms) Average CPU time used by the service. SQL Fetch Cnt. Number of DB Fetches recorded in the service. SQL Fetch Time (ms) Total DB Fetch processing time recorded in the service. Exception Cnt. Number of exception occurrences recorded in the service. User IP IP address of the user who requested the service. Start Time Service start time. End Time Service termination time.
-
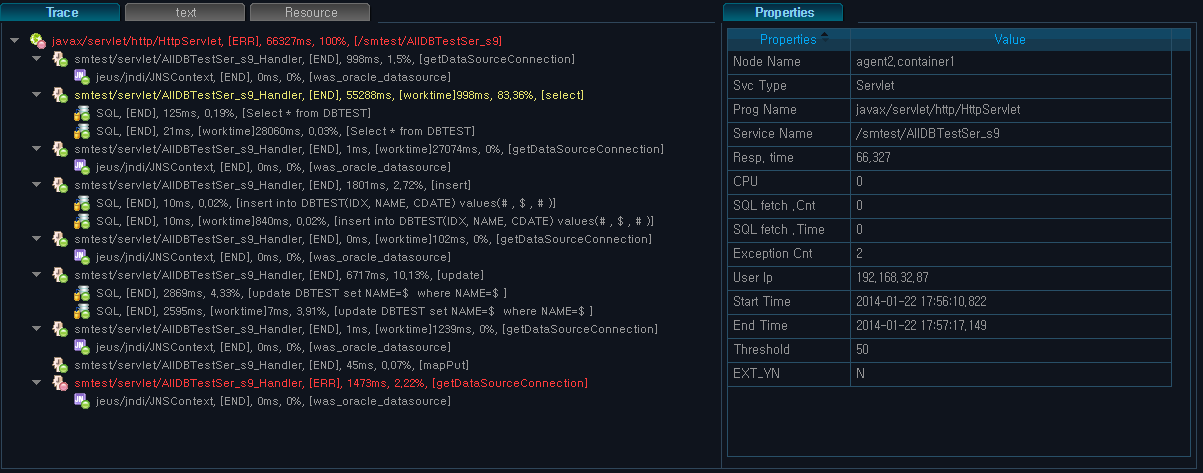
Trace
The trace tree can be accessed from the Trace Menu. Each trace consists of the Program Name, Status, Execution Time, % Occupied, and Service Name.
Select a service from the transaction execution list to see the General Properties table, and select a trace to see the Detailed Properties table.
-
General Properties
The following is description of the general properties.
Property Description Service Name Request name that identifies the service. (JSP URL, EJB Method, etc.) Node Name Service node name. Svc Type Transaction service type.
(user, servlet, JDBC, TP(external transaction), JNDI, EJB, Header, etc.)
Prog Name Service program name. (JSP URL, Servlet Class Name, EJB Class Name, etc.) Tx Code User-defined transaction code recorded in the service. Func code Requested service code. Resp.time Average service response time. CPU Average CPU time used by the service. SQL fetch.Cnt DB Fetch execution count. SQL fetch.Time SQL Fetch execution time. Exception Cnt Number of exception occurrences recorded in the service. User ID ID of the user who requested the service. User IP IP address of the user who requested the service. Start Time Service start time. End Time Service termination time. Threshold Response time threshold for transaction data collection. Threshold is configured for each service URL of a container. EXT_YN Enable saving SQL full text? (Y/N) -
Detailed Properties
The following is description of the detailed properties.
Property Description EXT_YN Enable saving SQL full text? (Y/N) Node Name Service node name. Prog Name Service program name. (JSP URL, Servlet Class Name, EJB Class Name, etc.) Svc Type Transaction service type.
(user, servlet, JDBC, TP(external transaction), JNDI, EJB, Header, etc.)
Tx Code User-defined transaction code recorded in the service. Func code Requested service code. Start Time Service start time. End Time Service termination time. Resp.time Average service response time. CPU Average CPU time used by the service. Exception Name Name of the exception that occurred in the service. Exception Msg Exception message that occurred in the service. User IP IP address of the user who requested the service. SQL fetch.Cnt DB Fetch execution count. SQL fetch.Time SQL Fetch execution time. param Configured parameters for Invocation call. Service Name Request name that identifies the service. (JSP URL, EJB Method, etc.) sql Executed SQL query.
-
-
Resource
The resource information can be accessed from the Resource Menu.
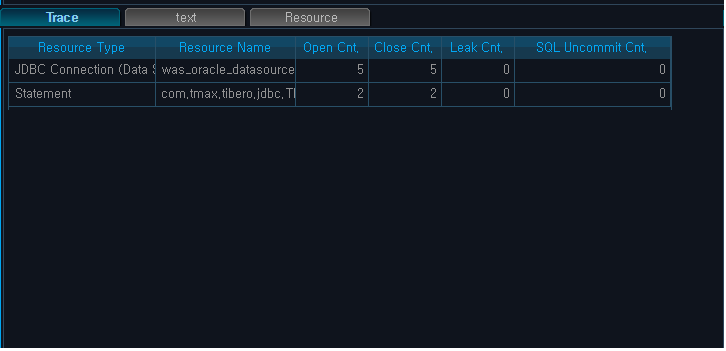
The following is description of the resource properties.
Property Description Resource Type Resource type. (Was, System) Resource Name Resource name. Open Cnt. Number of times resource was obtained. (E.g.: JDBC JDBC Connection Open) Close Cnt. Number of times resource was returned. Leak Cnt. Leak occurrence count. (calculated by subtracting Open Cnt. from Close Cnt.) SQL Uncommit Cnt. Number of SQLs that have not been committed.
If the trace property is SQL, SQL statement from the existing trace location can be viewed by selecting the SQL row from the properties table.
When [binding] is clicked, the
parameter values (in yellow) of the related query statement are displayed
as Binding Variables '?', and when
re-clicked, previous parameter values are shown. Click [close] to return to the trace screen.
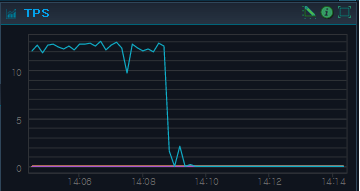
Throughput
JVM is refreshed every 10 seconds, and real-time service throughput is shown on a chart.
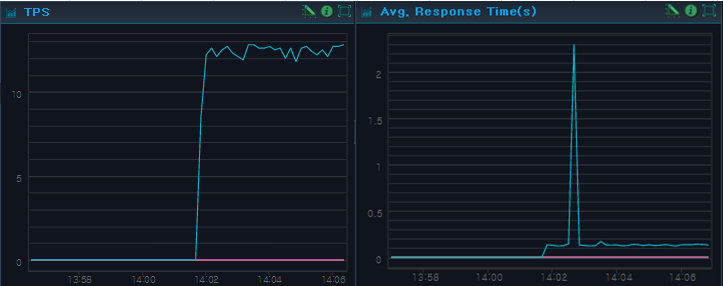
| Chart | Description |
|---|---|
| TPS | Transactions per second for the container selected in the Working List. (X axis: Most recent 10 minute period, Y axis: Transactions Per Second) |
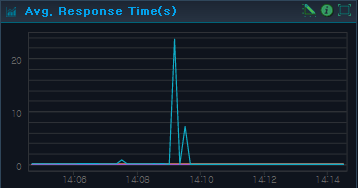
| Avg. Response Time(s) | Avg. response time for the container selected in the Working List. (X axis: Most recent 10 minute period, Y axis: Avg. response time(s)) |
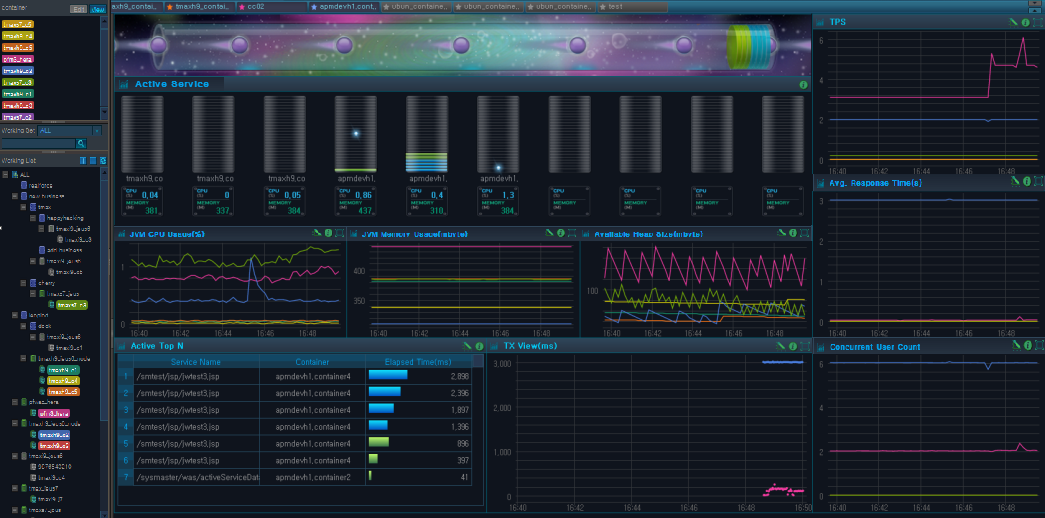
Using charts and tables, real-time dashboard dynamically displays various monitoring data, including Active Service Data, Host Data, Java Virtual Machine Data, User Data, Transaction View Data, Throughput, and Event Data. It provides additional host data and more variety of chart indicators compared to the Real-Time Dashboard.
Real-time user dashboard can be accessed from [WAS] > [Dashboard] > [User-defined Real-Time Dashboard].
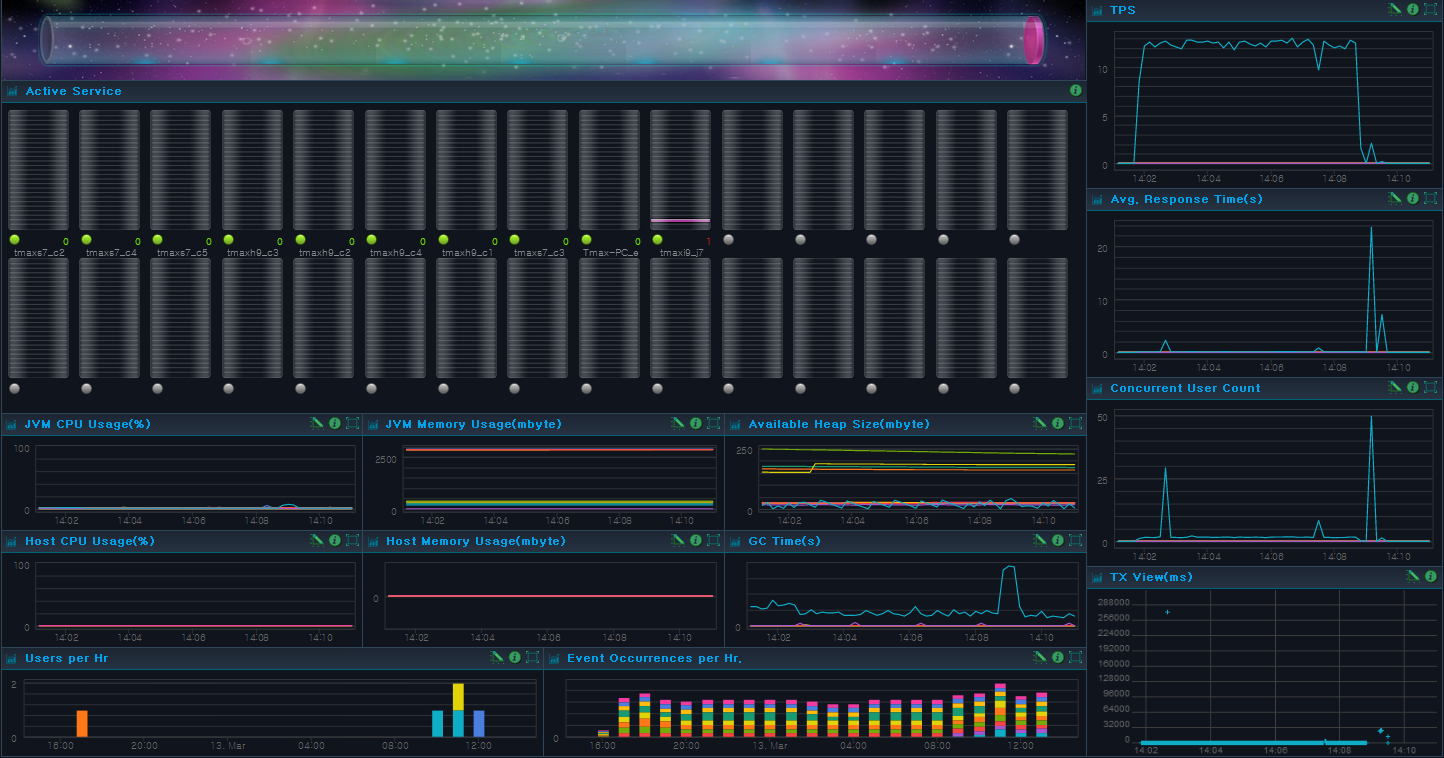
Active Service Data
Active Service Data is refreshed every 2 seconds. It consists of Active Speed Bar, Active Service Bar, and Active Top N. For description of each item, refer to "Active Service Data" in "2.4. Real-Time Dashboard".
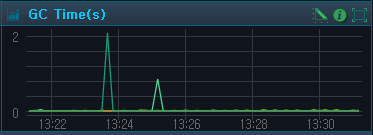
JVM Data
JVM Data is displayed for the container selected in the Working List. It consists of JVM CPU Usage(%), JVM Memory Usage(mbyte), Available Heap Size (mbyte), and GC Time (s). For description of each item except for GC Time(sec), refer to "JVM Data" in "2.4. Real-Time Dashboard".
-
GC Time(s)
Captures the times within the given time frame spent in Garbage Collection.
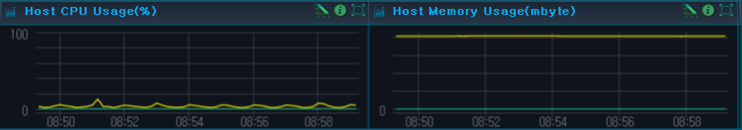
Host Data
Host Data displays data for the system where WAS is installed. It captures the system data for the selected container or node in the Working List. The host status data is collected for each Agent, and is displayed on a graph in units of an Agent. Data is refreshed every 10 seconds.
| Chart | Description |
|---|---|
| Host CPU Usage (%) | CPU usage of the container system selected in the Working List. For multiple CPUs, the average value is displayed. Displays snapshot data that is refreshed every 10 seconds. (X axis: Most recent 10 minute period, Y axis: Host CPU usage(%)) |
| Host Memory Usage (mbyte) | Memory usage of the host of the container selected in the Working List. Displays snapshot data that is refreshed every 10 seconds. (X axis: Most recent 10 minute period, Y axis: Host memory usage (MB)) |
Throughput
Throughput displays throughput data of the container selected in the Working List.
Throughput consists of TPS, Avg. Response Time (s), Current Day's TPS, Current Day's Avg. Response Time (s). For more information about TPS and Avg. Response Time, refer to "Throughput" in "2.4. Real-Time Dashboard".
-
TPS
Displays TPS (Transactions per second) data of each container for the most recent 24 hour period based on the Master clock.
-
Avg. Response Time(s)
Displays average service response time data of each container for the most recent 24 hour period based on the Master clock.
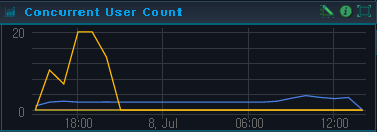
User Data
User Data displays user data of the container selected in the Working List. It consists of the Number of Concurrent Users, Current Day's Number of Concurrent Users, Number of Users Per Hour, and Number of Event Occurrences Per Hour. For more information about the number of concurrent users, refer to "User Data" in "2.4. Real-Time Dashboard".
-
Concurrent User Count
Displays number of concurrent users of each container for the most recent 24 hour period based on the Master clock.
-
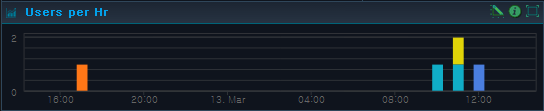
Users Per Hr
Displays the number of users per hour by container using a bar chart.
-
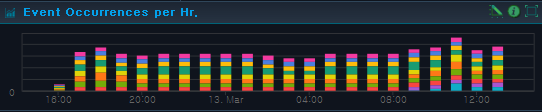
Event Occurrences per Hr
Displays the number of event occurrences per hour by container.
TX View Data
For information about transaction view, refer to "Transaction View Data" in "2.4. Real-Time Dashboard".
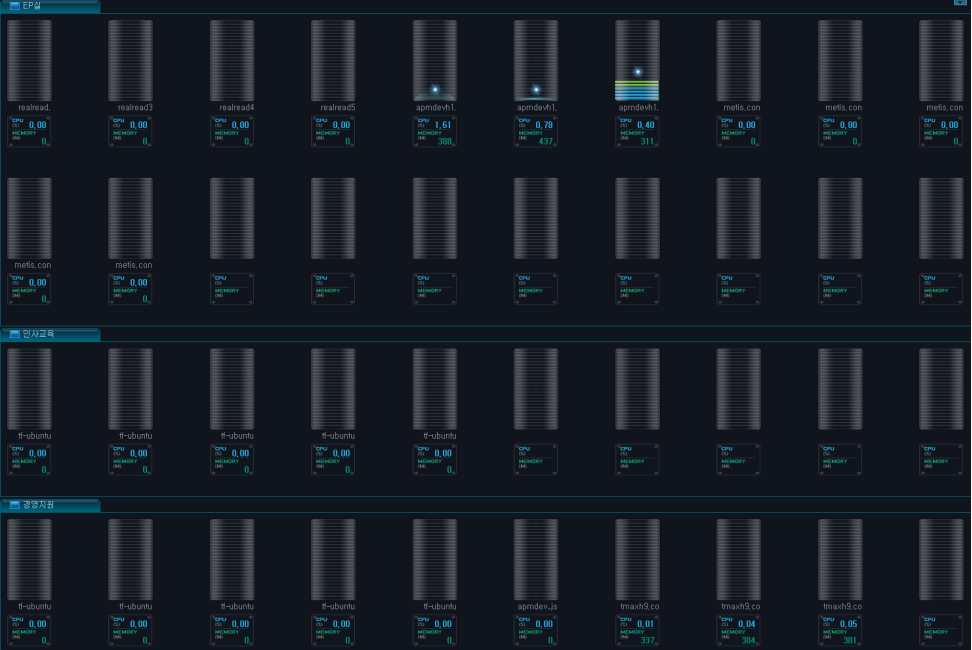
Data for the system where WAS is installed can be viewed from [User-defined System Dashboard]. It displays data for the host system which includes the node selected in the Working List. Data is refreshed every 10 seconds.
User-defined system dashboard can be accessed from [Tmax] > [Dashboard] > [User-defined System Dashboard].
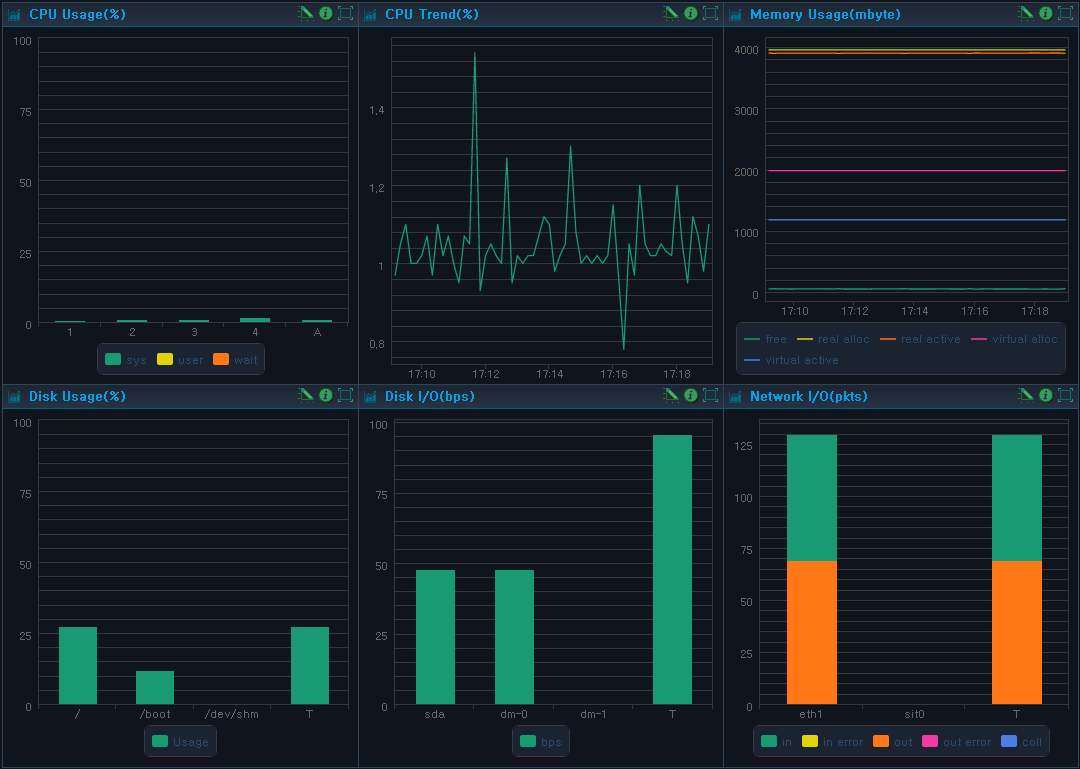
| Chart | Description |
|---|---|
| CPU Usage (%) | Displays all CPU utilization data items.
(X axis: CPU Name, Y axis: CPU Usage(%)) |
| Memory Usage (mbyte) | Memory size being used by the host.
(X axis: Most recent 10 minute period, Y axis: Memory usage (MB)) |
| CPU Trend(%) | Server CPU trends for 10 minute period. (X axis: Most recent 10 minute period, Y axis: CPU usage (%) |
| Disk Usage(%) | Disk usage in percentage. (X axis: System path, Y axis: Disk usage (%)) |
| Disk I/O(bps) | Disk I/O in bps. (X axis: Disk I/O name, Y axis: Disk I/O (bps)) |
| Network I/O(ipkts) | Network I/O in ipkts. (X axis: Network I/O name, Y axis: Network I/O (pkts)) |
In Custom Dashboard, a user can select the desired dashboard and create a menu for it.
Select a widget from [ADMIN] > [Custom Dashboard] > [Dashboard], and adjust its size and location. After arranging the dashboard, save the dashboard to register it in the [Dashboard] menu. For detailed information, refer to "SysMaster Administrator Guide".
The following is an example of a Custom Dashboard.