Table of Contents
This chapter describes the Real-Time Analysis screen.
Real-Time Analysis screen provides detailed information needed for real-time monitoring of servers and WASs that are registered in SysMaster. The main function of Real-Time Analysis screen is to provide detailed information. When failure is detected during normal monitoring activity from the dashboard, Real-Time Analysis screen can be used to analyze the status of a single container.
Real-Time Analysis can be accessed from [WAS] > [Real-Time Analysis].
Real-Time Analysis Menu consists of the following two items.
-
Working List
A single container can be selected from the Working List to analyze its status in real-time. For more information, refer to "1.4. Working List".
-
Monitoring / Analysis
Data is displayed in charts and using summary tables by business and instance for each of the following sub menus.
Menu Item Description [Service(Active)] Check real-time data for Service, SQL, exception, and external transactions. [Snapshot] Check real-time data for threads, class loaders, collection objects, files, sockets, sessions, and environment variables. [Event] Check current day's event statuses and list of events.
Service(Active) provides information related to the currently running services such as EJBs, Servlets, etc.
Service(Active) can be accessed from [WAS] > [Real-Time Analysis] > [Service] and consists of the following tabs.
-
[Top N]
-
[Service]
-
[SQL]
-
[Exception]
-
[External Transaction]
Click [+ More] from each table to move to the related tab to see more detailed information.
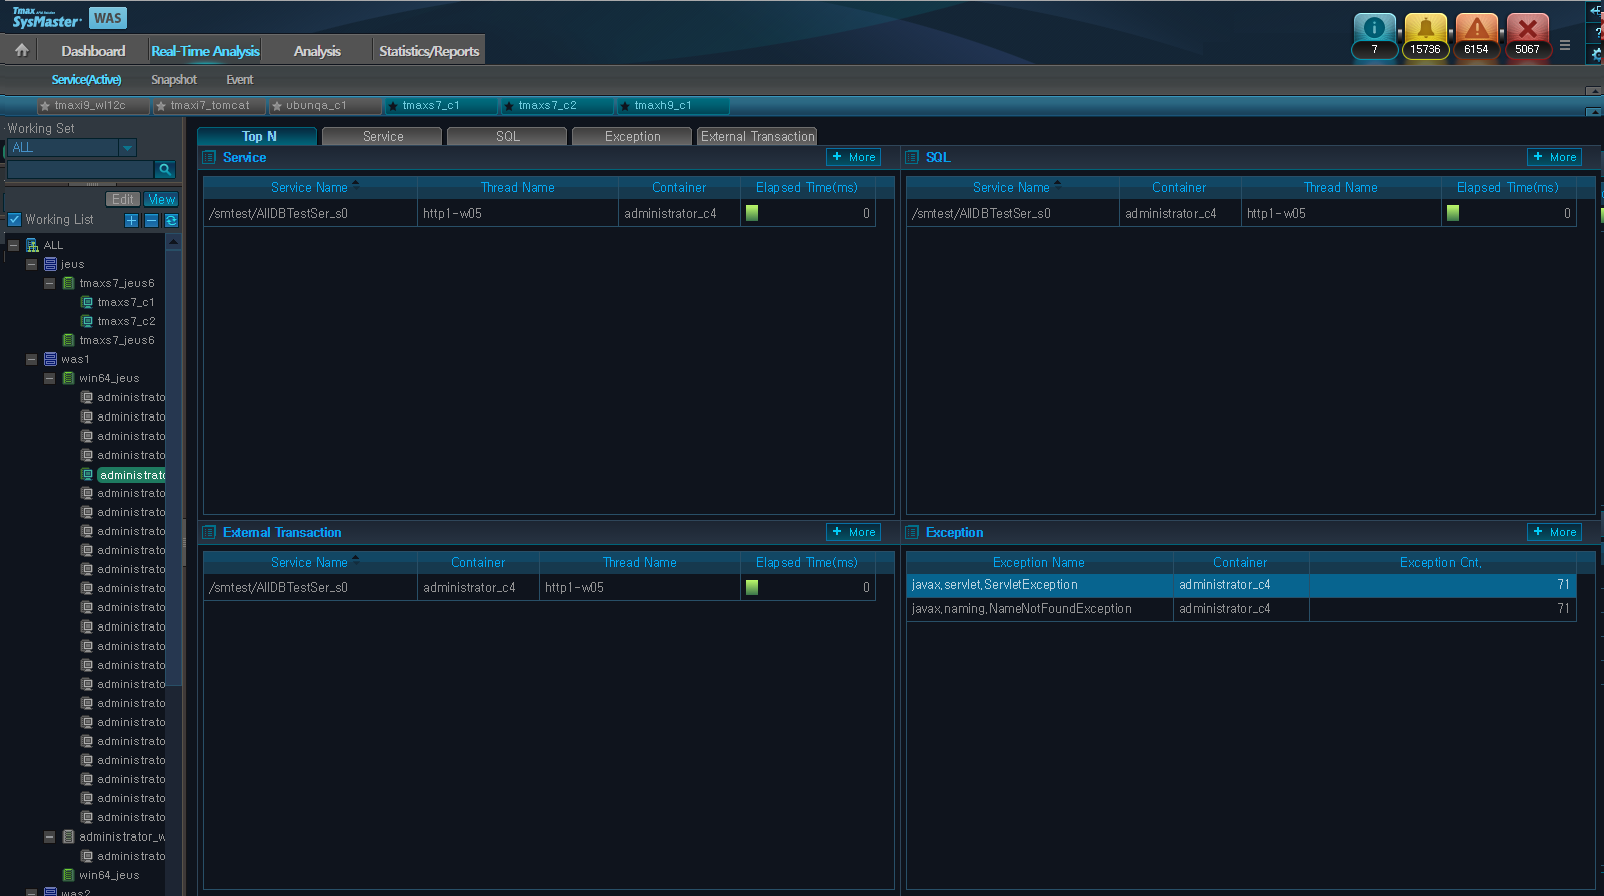
Top N displays a table of Top N services, SQLs, exceptions, and external transactions for the selected container. 'Elapsed Time' value is used to select the Top N rows. Click [Search] from each table to move to the related tab to see more detailed information.
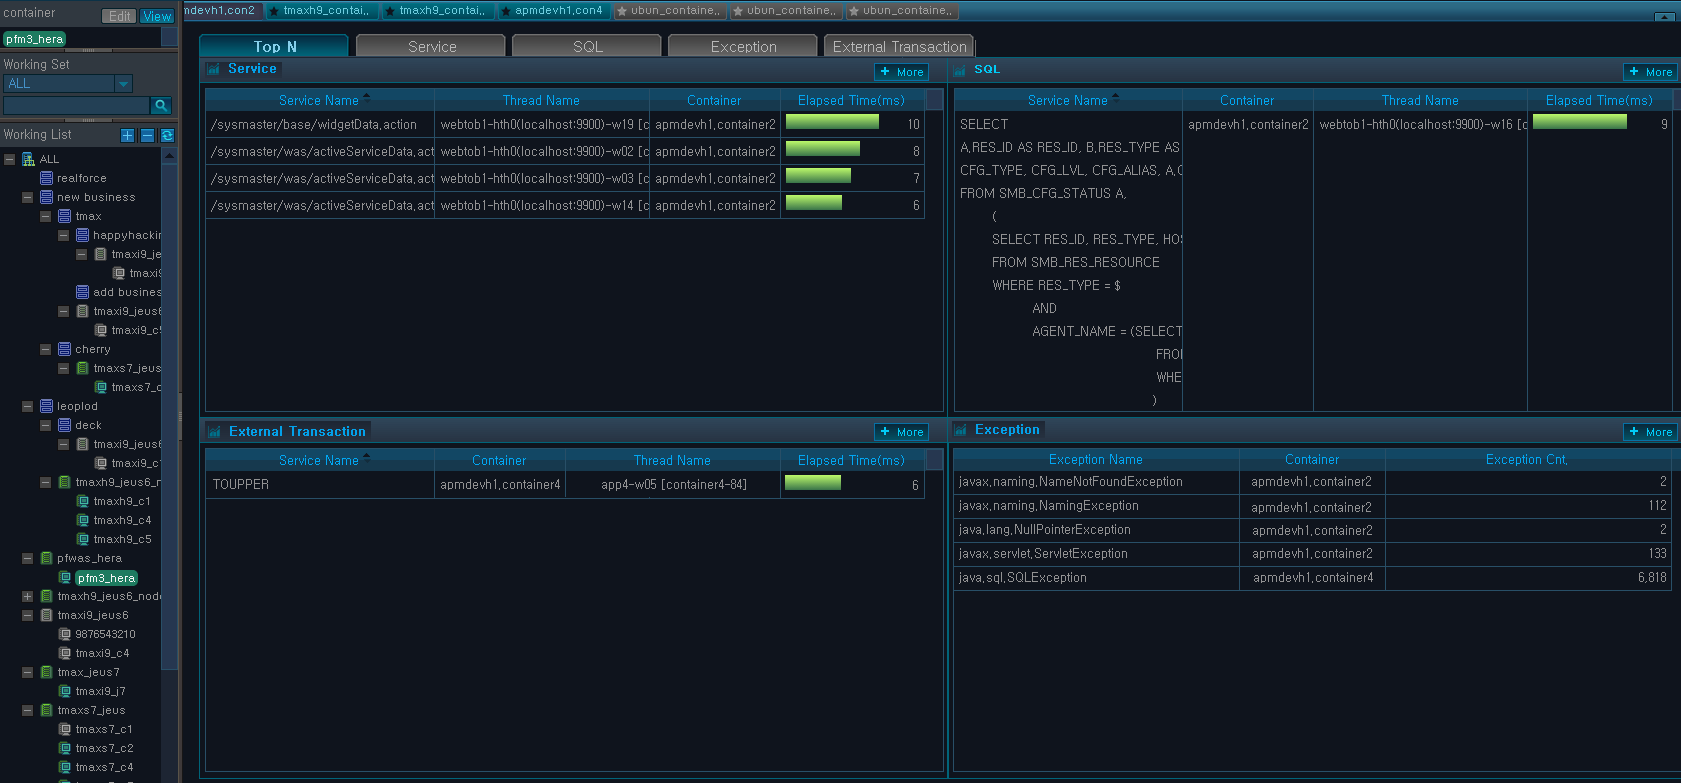
Service
Displays a list of currently running services in the descending order of 'Elapsed Time' for the selected container.
| Property | Description |
|---|---|
| Service Name | Request name that identifies the service. (JSP URL, EJB Method, etc.) |
| Thread Name | Thread name of the currently running service. |
| Container | Information about the container where the transaction originated from. |
| Elapsed Time(ms) | Duration for service processing. |
Detailed service information can be viewed on a popup window by selecting a specific service. For more information about Active Service popup window, refer to "Active Top N" in "2.4. Real-Time Dashboard".
SQL
Displays SQL queries that are currently executing.
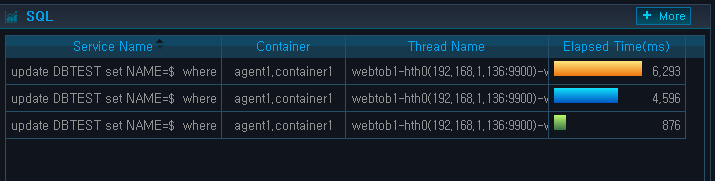
| Property | Description |
|---|---|
| Service Name | Request name that identifies the service. (SQL query) |
| Container | Information about the container where the transaction originated from. |
| Thread Name | Thread name of the currently running service. |
| Elapsed Time(ms) | Duration for service processing. |
External Transaction
Displays external transaction data that is received through TP.
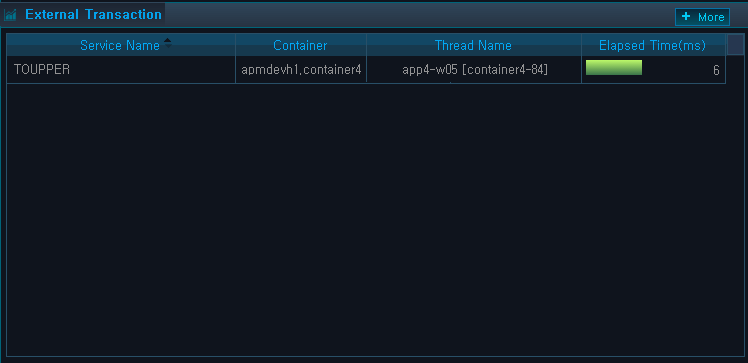
| Property | Description |
|---|---|
| Service Name | Request name that identifies the service. (JSP URL, EJB Method, etc.) |
| Container | Information about the container where the transaction originated from. |
| Thread Name | Thread name of the currently running service. |
| Elapsed Time(ms) | Service processing duration. |
Exception
Displays a list of Java EE exception types (SQLException, NullPointException, ServletException, SocketException, FileIOException, etc.) and their number of occurrences. Note that the exceptions that are handled by Try/Catch blocks are excluded.
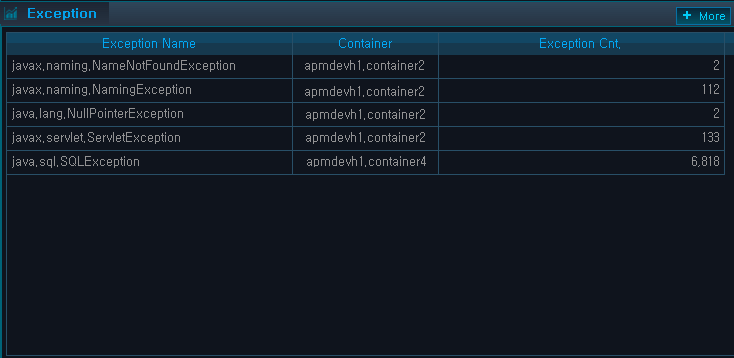
| Property | Description |
|---|---|
| Exception Name | Type of exception that occurred in the transaction. |
| Container | Information about the container where the transaction originated from. |
| Exception Cnt. | Number of exception occurrences. |
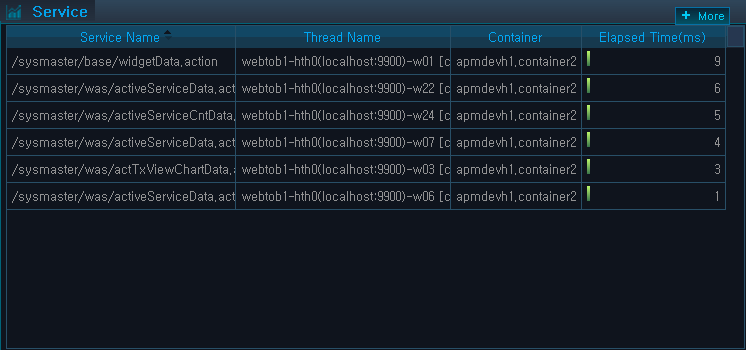
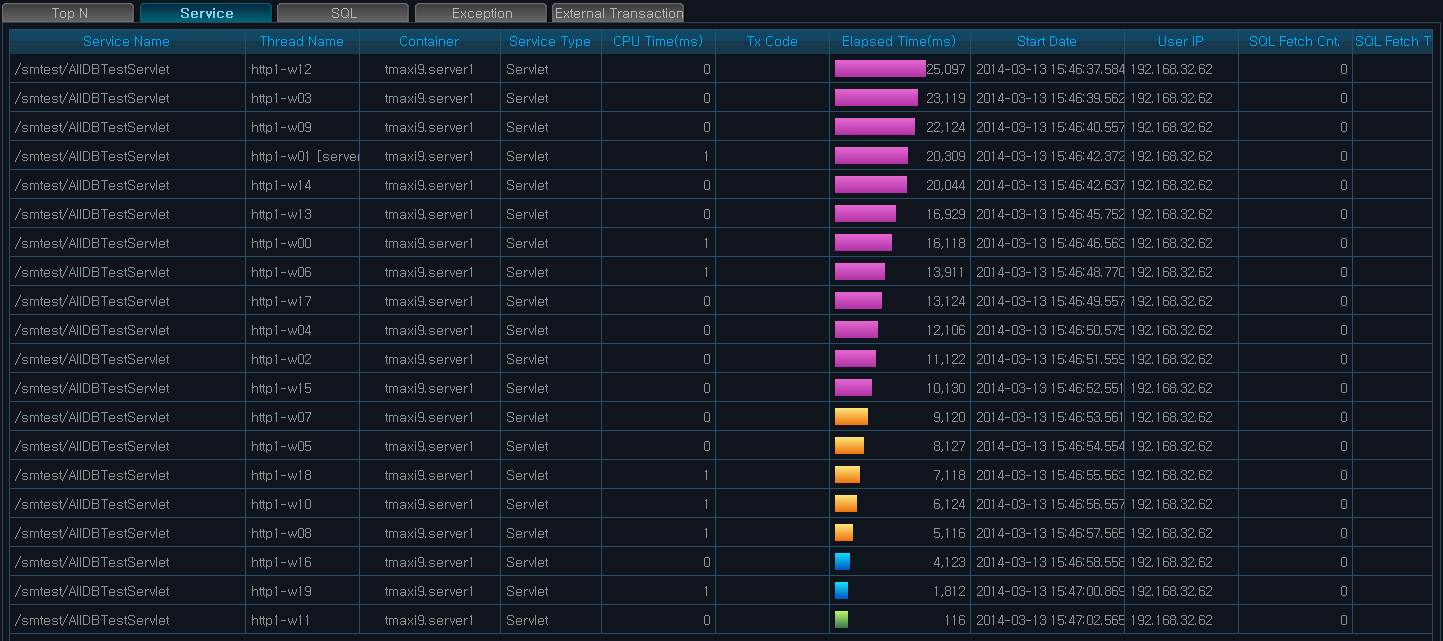
Service displays a list of running services for the selected container in the descending order of 'Elapsed Time.' It contains more detailed information than the Service table in [Top N] tab.
| Property | Description |
|---|---|
| Service Name | Request name that identifies the service. (JSP URL, EJB Method, etc.) |
| Thread Name | Thread name of the currently running service. |
| Container | Information about the container where the transaction originated from. |
| Service Type | Transaction service type. (user/servlet/JDBC/TP(external transaction)/JNDI/EJB/Header, etc.) |
| CPU Time(ms) | Average CPU time used by the service. |
| Tx Code | User-defined transaction code recorded in the service. |
| Elapsed Time(ms) | Service processing duration. |
| Start Date | Service start date and time. |
| User IP | IP address of the user who requested the service. |
| SQL Fetch Cnt | DB Fetch execution count. |
| SQL Fetch Time(ms) | SQL Fetch execution time. |
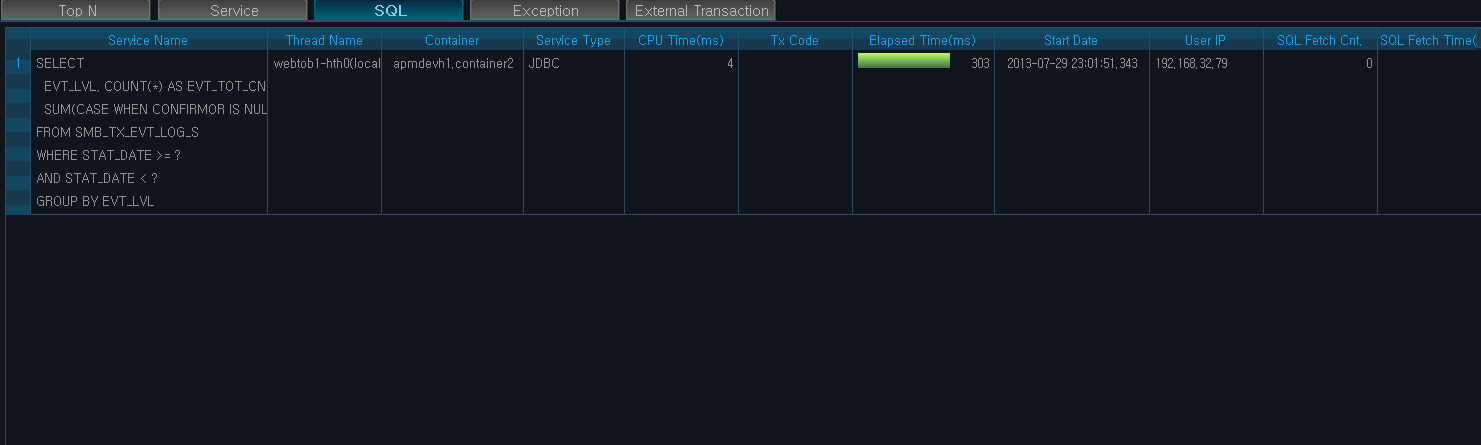
SQL displays currently executing SQL queries in detail.
| Property | Description |
|---|---|
| Service Name | Currently executing SQL. |
| Thread Name | Thread name of the currently running service. |
| Container | Information about the container where the transaction originated from. |
| Service Type | Transaction service type. (user/servlet/JDBC/TP(external transaction)/JNDI/EJB/Header, etc.) |
| CPU Time(ms) | Average CPU time used by the service. |
| Tx Code | User-defined transaction code recorded in the service. |
| Elapsed Time(ms) | Service processing duration. |
| Start Date | Service start date and time. |
| User IP | IP address of the user who requested the service. |
| SQL Fetch Cnt. | DB Fetch execution count. |
| SQL Fetch Time(ms) | SQL Fetch execution time. |
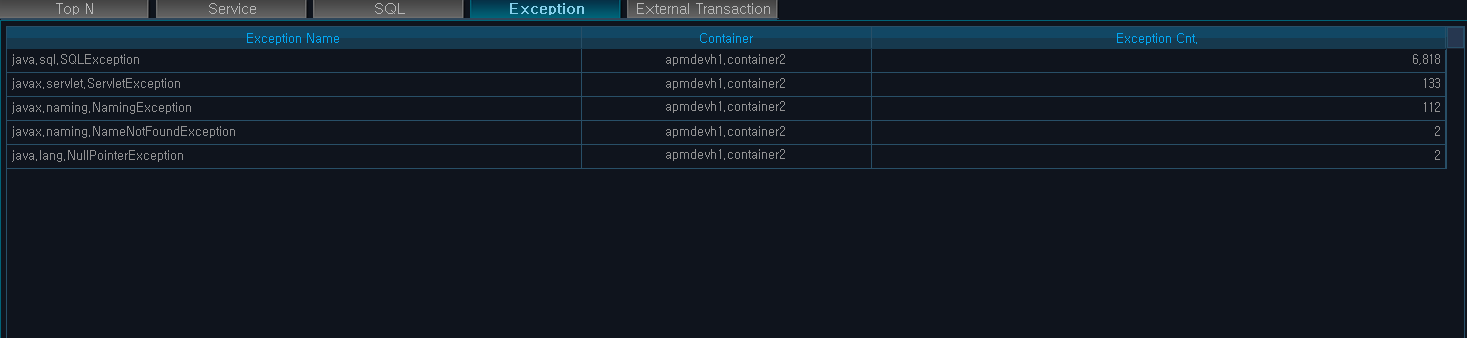
Exception displays a list of Java EE exception types (SQLException, NullPointException, ServletException, SocketException, FileIOException, etc.) and their number of occurrences. Note that only the exceptions that thrown are handled here.
| Property | Description |
|---|---|
| Exception Name | Type of exception that occurred in the transaction. |
| Container | Information about the container where the transaction originated from. |
| Exception Cnt. | Number of exception occurrences. |
External Transaction displays external transaction data that is received through TP.

| Property | Description |
|---|---|
| Service Name | Request name that identifies the service. (JSP URL, EJB Method, etc.) |
| Thread Name | Thread name of the currently running service. |
| Container | Information about the container where the transaction originated from. |
| Service Type | Transaction service type. (user/servlet/JDBC/TP(external transaction)/JNDI/EJB/Header, etc.) |
| CPU Time(ms) | Average CPU time used by the service. |
| Tx Code | User-defined transaction code recorded in the service. |
| Elapsed Time(ms) | Service processing duration. |
| Start Date | Service start date and time. |
| User IP | IP address of the user who requested the service. |
| SQL Fetch Cnt | DB Fetch execution count. |
| SQL Fetch Time(ms) | SQL Fetch execution time. |
Snapshot displays various data by saving snapshots of the execution. It shows the current snapshot data of the currently running container at the time of the search.
Snapshot can be accessed from [WAS] > [Real-Time Analysis] > [Snapshot] and consists of the following tabs.
-
[Thread]
-
[Class Loader]
-
[Collection Object]
-
[File]
-
[Socket]
-
[Session]
-
[Environment Variable]
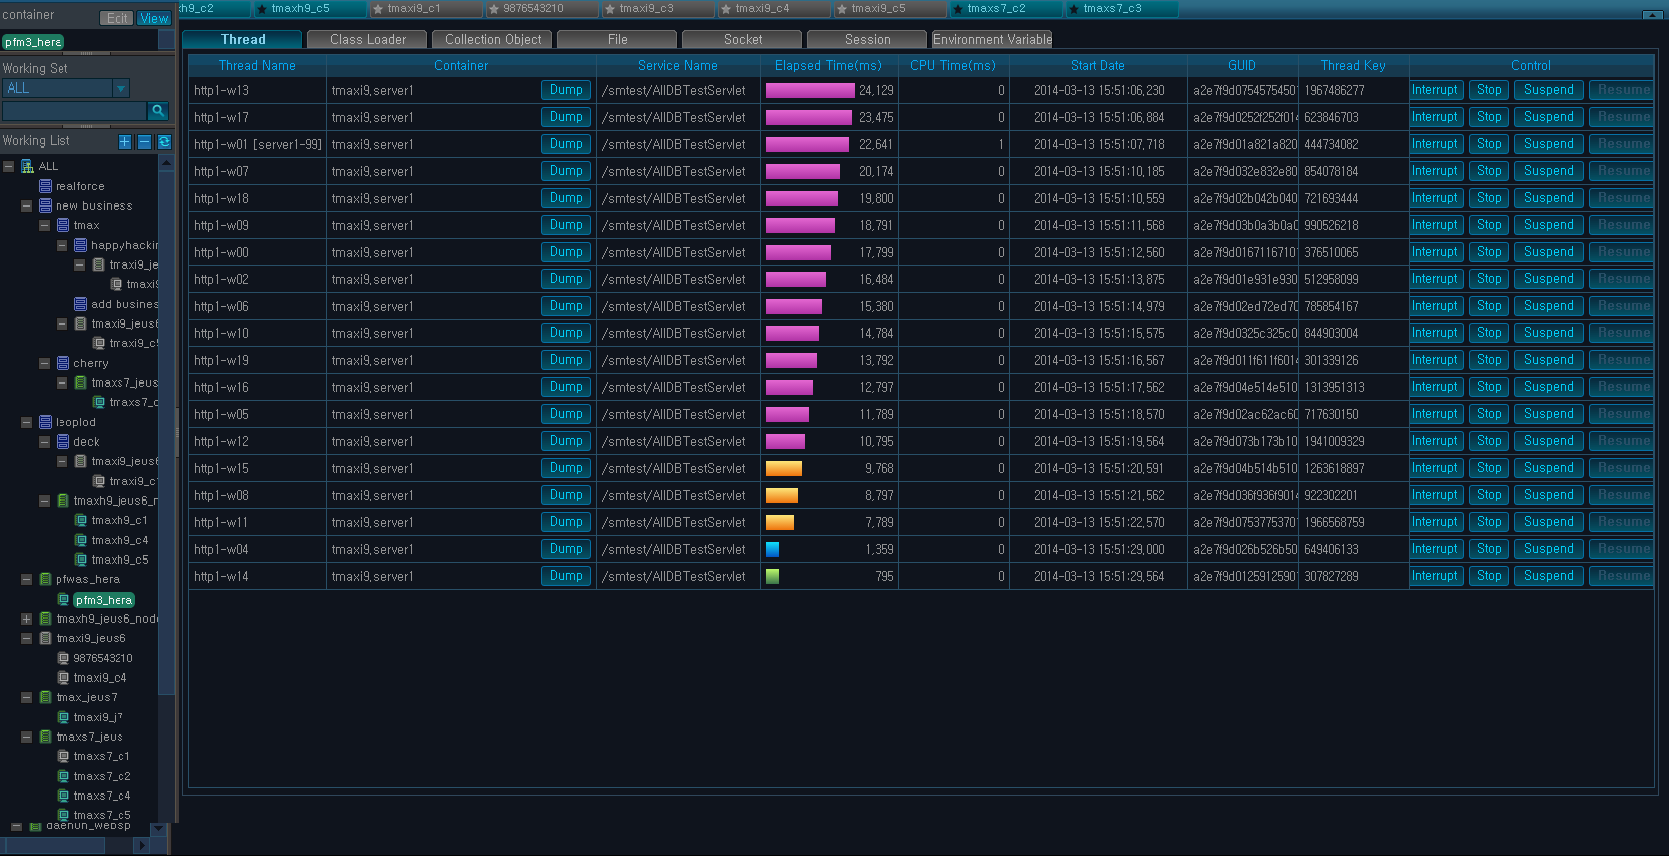
Thread displays thread data for the currently running service of the container, and the container's thread dump data. Thread dump data can be used to check for statuses such as BLOCKED, DEADLOCK, etc., and stack traces of the thread can be analyzed to resolve abnormal thread conditions.
| Property | Description |
|---|---|
| Thread Name | Thread name of the currently running service. |
| Container | Information about the container where the transaction originated from. |
| Service Name | Request name that identifies the service. (JSP URL, EJB Method, etc.) |
| Elapsed Time(ms) | Service processing duration. |
| CPU Time(ms) | Average CPU time used by the service. |
| Start Date | Service start date and time. |
| Control | Thread status configuration. |
The following is description of the service control buttons.
| Button | Description |
| [Resume] | Calls Thread Resume method to resume the thread. |
| [Suspend] | Calls Thread Suspend method of stop the thread. |
| [Stop] | Calls Thread Stop method to forcibly stop the thread. |
| [Interrupt] | Calls Thread Interrupt method to stop a thread that has been in the wait state for a long time. |
| [Dump] | Gets the Thread Dump and displays its data. |
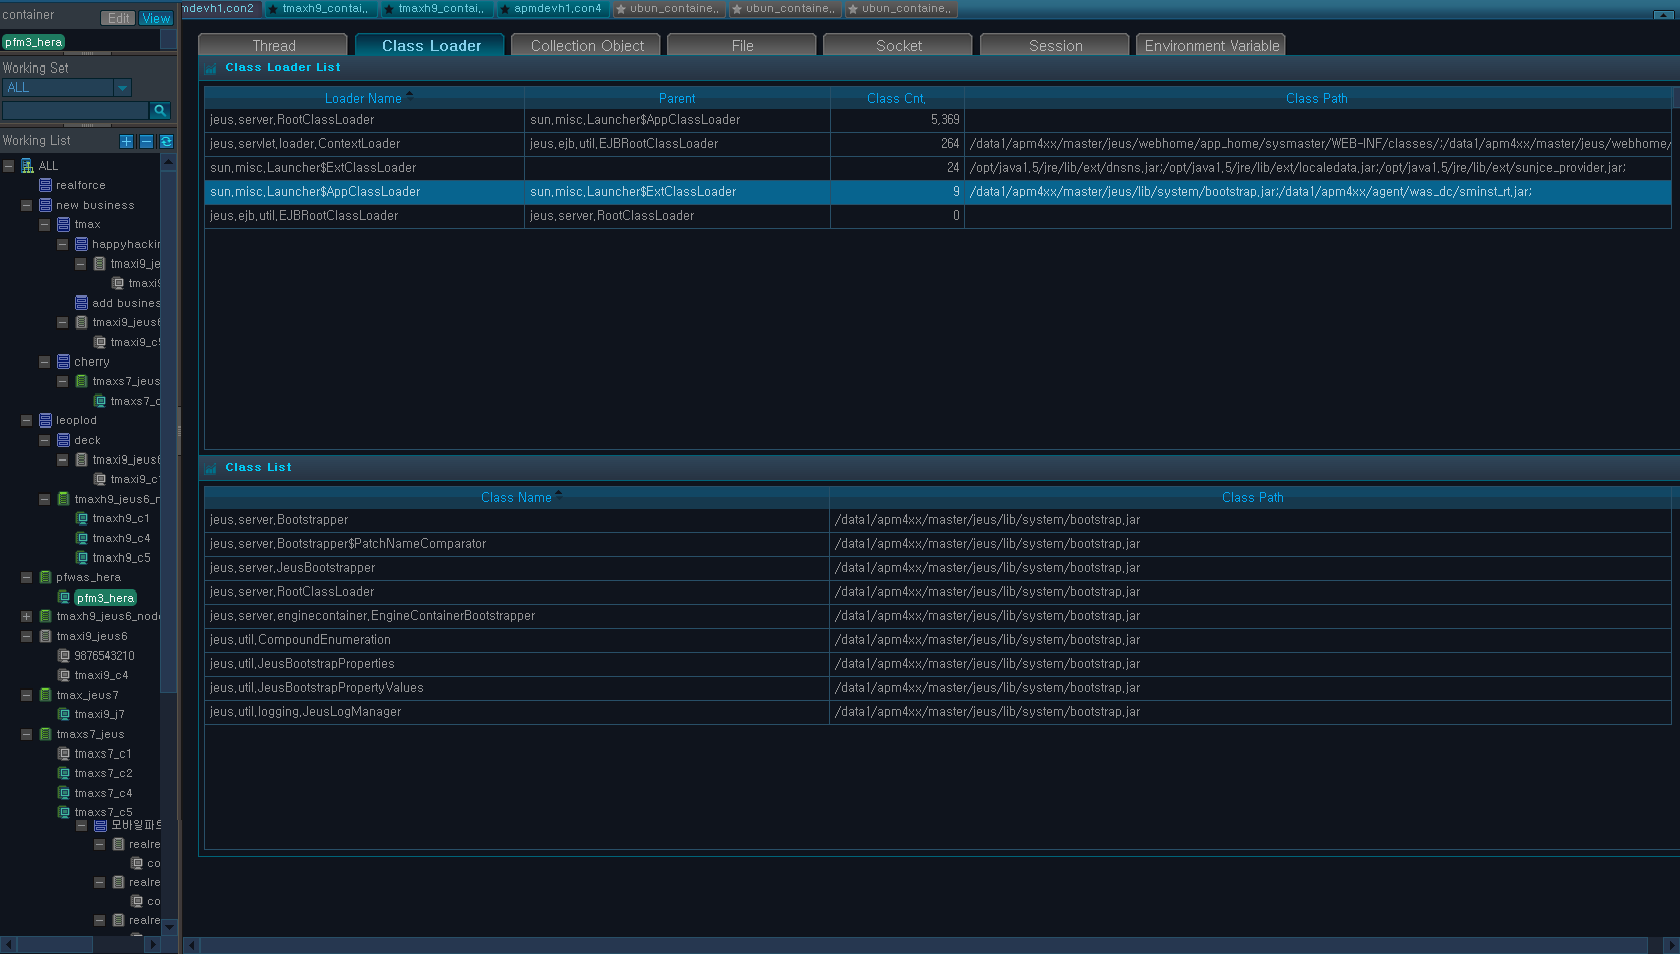
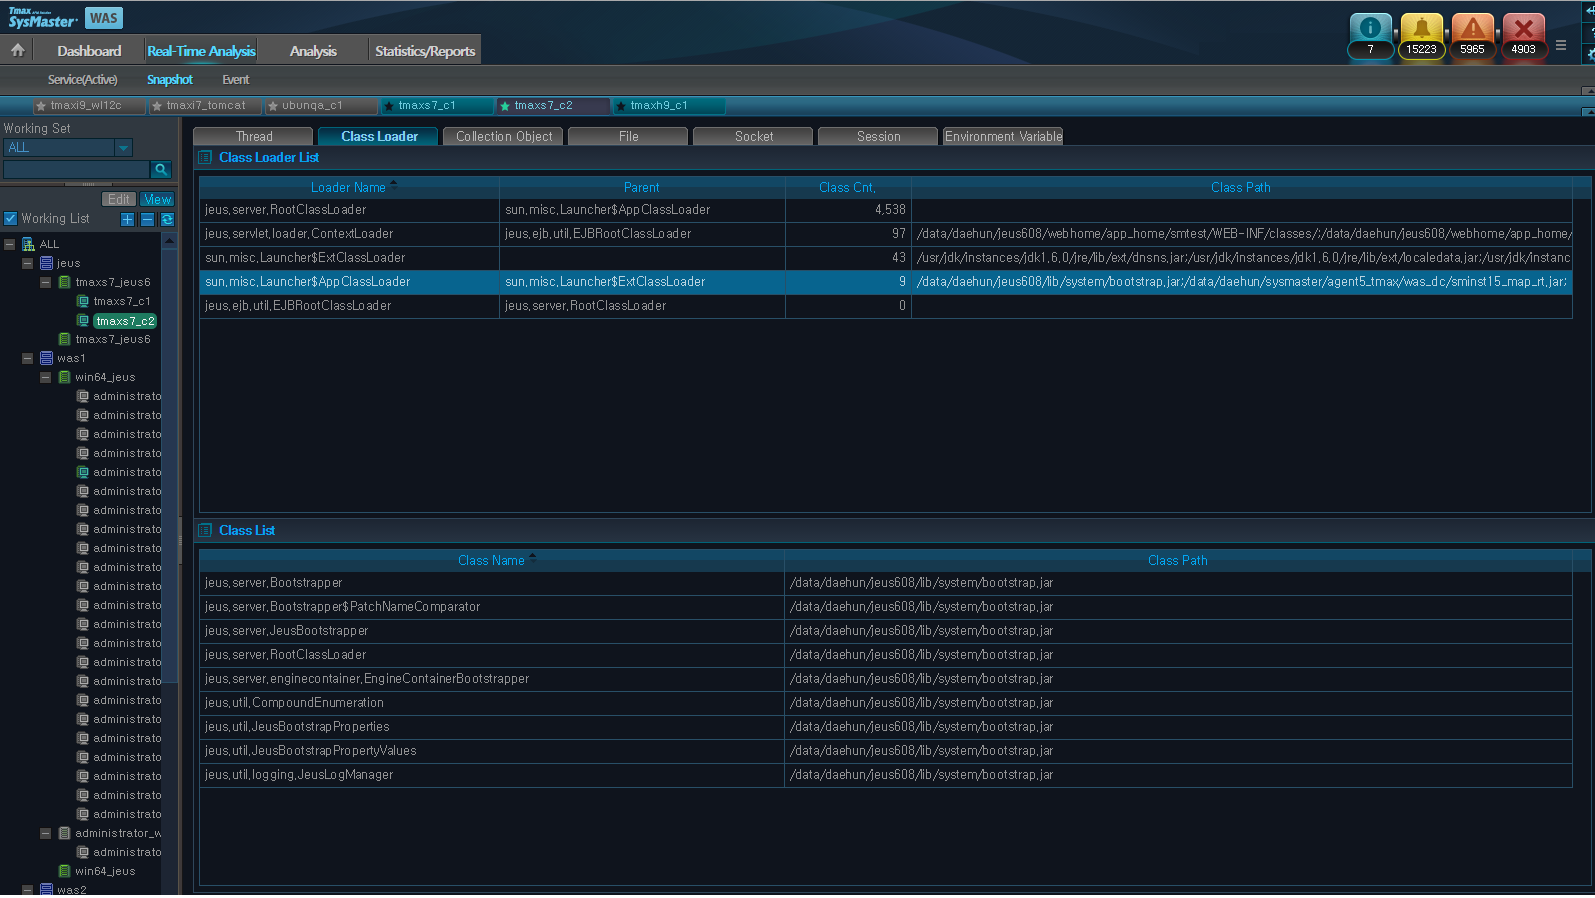
Class Loader displays information about all classes that have been loaded. Class Loader's main function is to load the class during runtime without stopping the VM. It shows the total number of times each Class has been loaded. When a row is selected from the Class Loader List, a Class List table that contains a detailed list of classes for the class loader is displayed below.
-
Class Loader List
The following is description of the Class Loader List Properties.
Property Description Loader name Class loader name. Parent Parent class loader. Class Cnt. Number times the class has been loaded. Class Path Class path. -
Class List
The following is description of the Class List Property.
Property Description Class Name Loaded class name. Class Path Class path.
Collection Object displays a list of collection objects, such as Vertor, HaspMap, and LinkedhaspMap, that are detected in the container.
Active Collection List displays the number of instances and objects created for each collection type. When an error is detected in a collection object, the class name and stack trace information can be used to determine the origination of the error.
When a row is selected from the Active Collection List, stack trace is displayed in the Collection Stack Trace table below.
| Property | Description |
|---|---|
| Container | The name of the container of the service where a collection object is detected. |
| Class Name | Collection implementation class name. |
| Object Cnt. | The number of times java object was registered to the Collection. |
| Created On | Time when Collection Object is created. |
| Trace Created On | Time when Collection Object's call trace is created. |
| Stack Trace | Whether to track the stack trace for where Collection was created. |
Log files for each container contain information about the files that are being used by the container, and the file's I/O status and I/O byte data. They can be used to locate a particular file used by the container through the file path information, and to get the file properties.
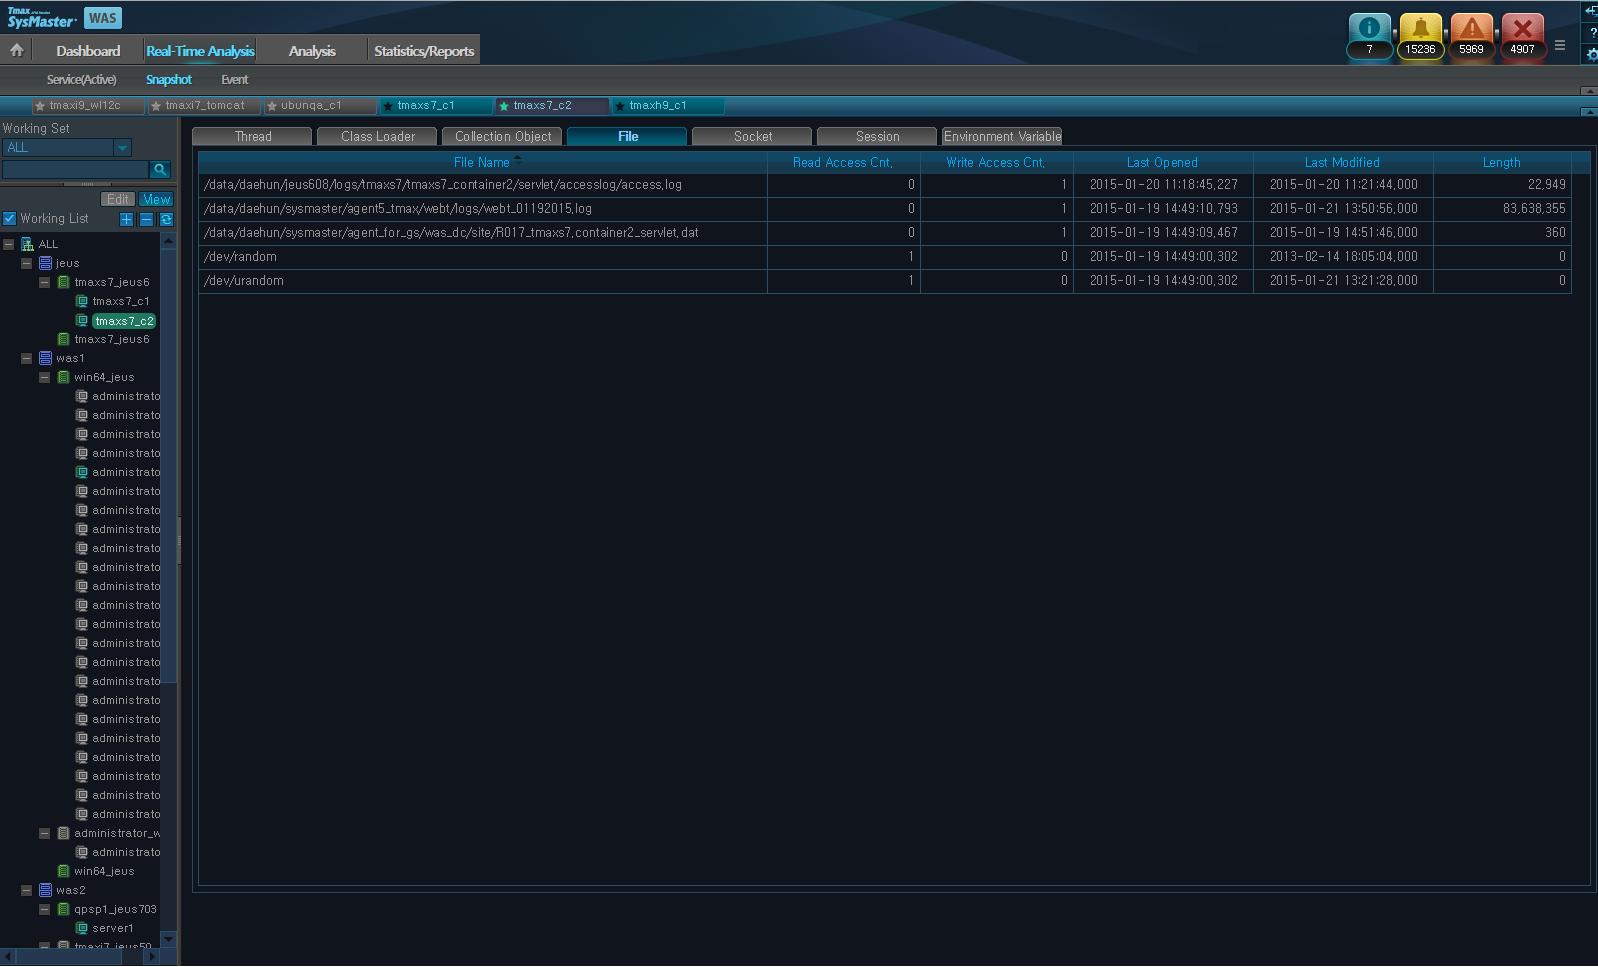
| Property | Description |
|---|---|
| File Name | File name and path. |
| Read Access Cnt. | Number of file reads. |
| Write Access Cnt. | Number of file writes. |
| Last Opened | Last accessed date and time of the file. |
| Last Modified | Last modified date and time of the file. |
| Length | File length. (byte) |
Socket displays information about container sockets, including I/O byte for each socket, socket creation date, etc.
[Figure 3.15] Real-Time Analysis - Snapshot - Socket
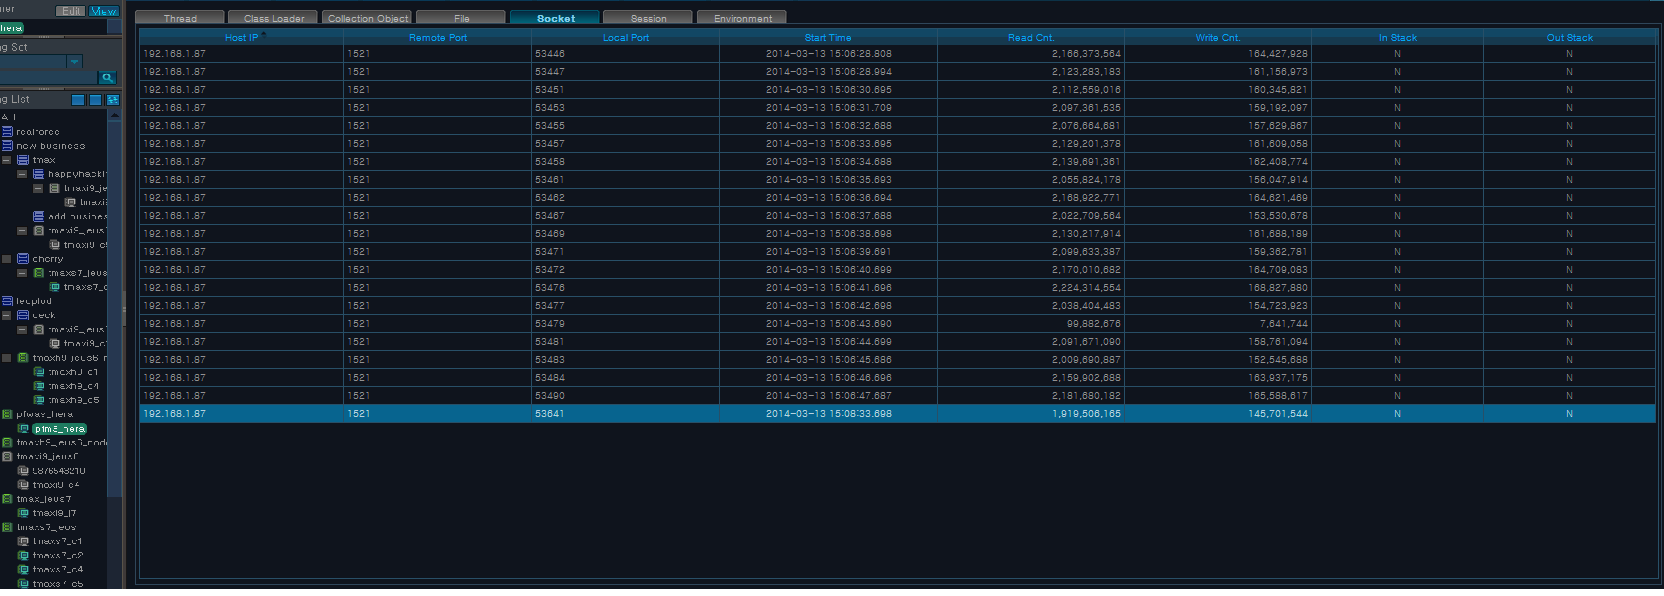 |
| Property | Description |
|---|---|
| Host IP | Host IP Address. |
| Remote Port | Remote port number. |
| Local Port | Local port number. |
| Start Time | Socket start date and time. |
| Read Cnt. | Socket Read invocation count. |
| Write Cnt. | Socket Write invocation count. |
| In Stack | Enable In Stack? |
| Out Stack | Enable Out Stack? |
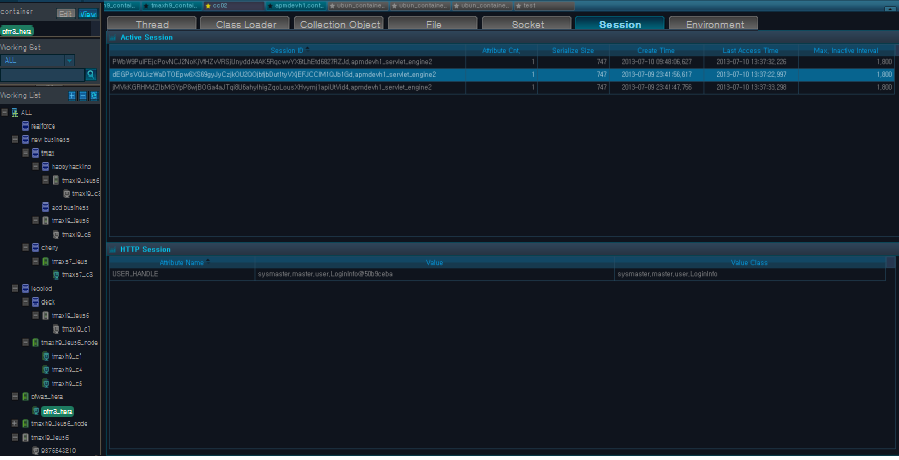
Session displays a list of sessions started in the container and their properties. When a row is selected from the Active Session List, the selected session's properties are displayed in the HTTP Session table below.
-
Active Session
The following is description of the table properties.
Property Description Session ID ID of HTTP session object. Attribute Cnt. Number of attributes of the session. Serialize Size Data size. Create Time Time when HTTP session object is created. Last Access Time Last time when HTTP session's properties were accessed. Max. Inactive Interval Expiration time for HTTP session object that is maintained but not accessed by the container. -
HTTP Session
The following is description of the table properties.
Property Description Attribute Name Attribute name of the session. Value Session value. Session Class Class information of the session.
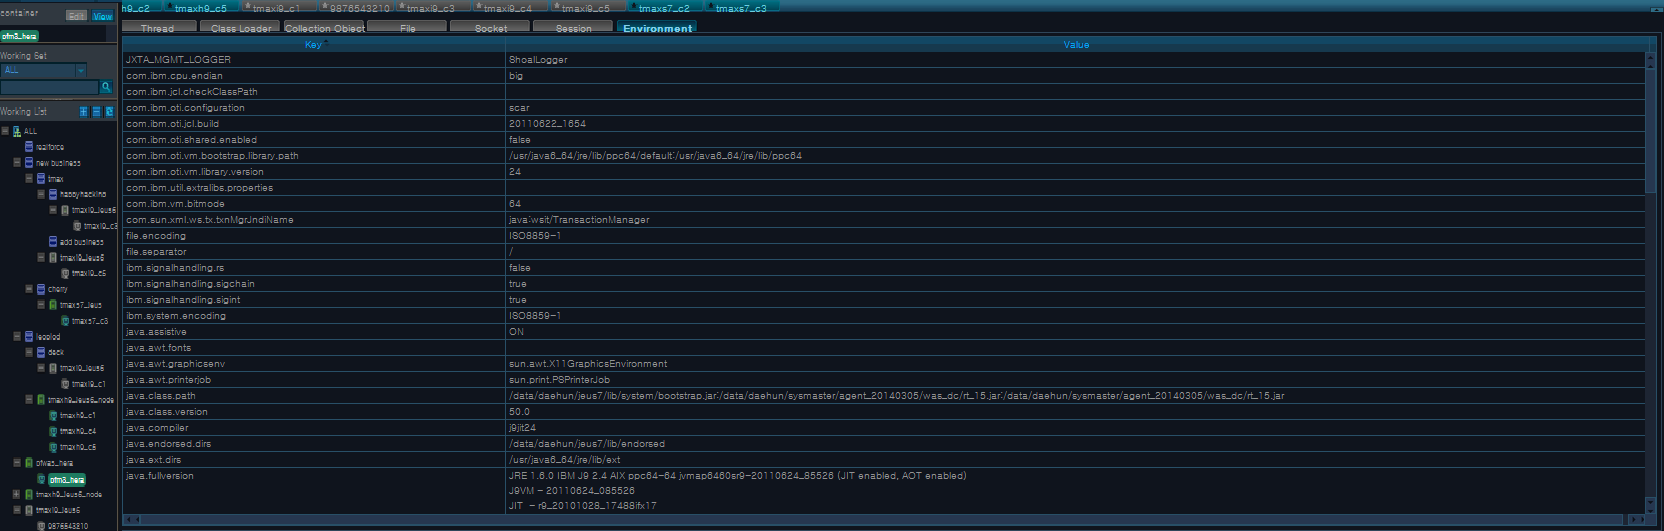
Environment Variable displays information about the environment variables that are used by the container. All JVM environment variables and container environment variables can be viewed without any separate configurations.
The following is the Environment Variable screen.
Event displays a list of unchecked events by event type (INFO, WARNING, CRITICAL, or FATAL) for viewing and analysis.
Event can be accessed from [WAS] > [Real-Time Analysis] > [Event] and consists of the following tabs.
-
[Current Day's Event Status]
-
[Events]
Event threshold can be modified from [ADMIN] > [Event] > [Threshold Settings]. For more information about threshold settings, refer to "SysMaster Administrator Guide".
Current Day's Event Status displays a list of unconfirmed events that occurred on the current day between 0:00 to 24:00.
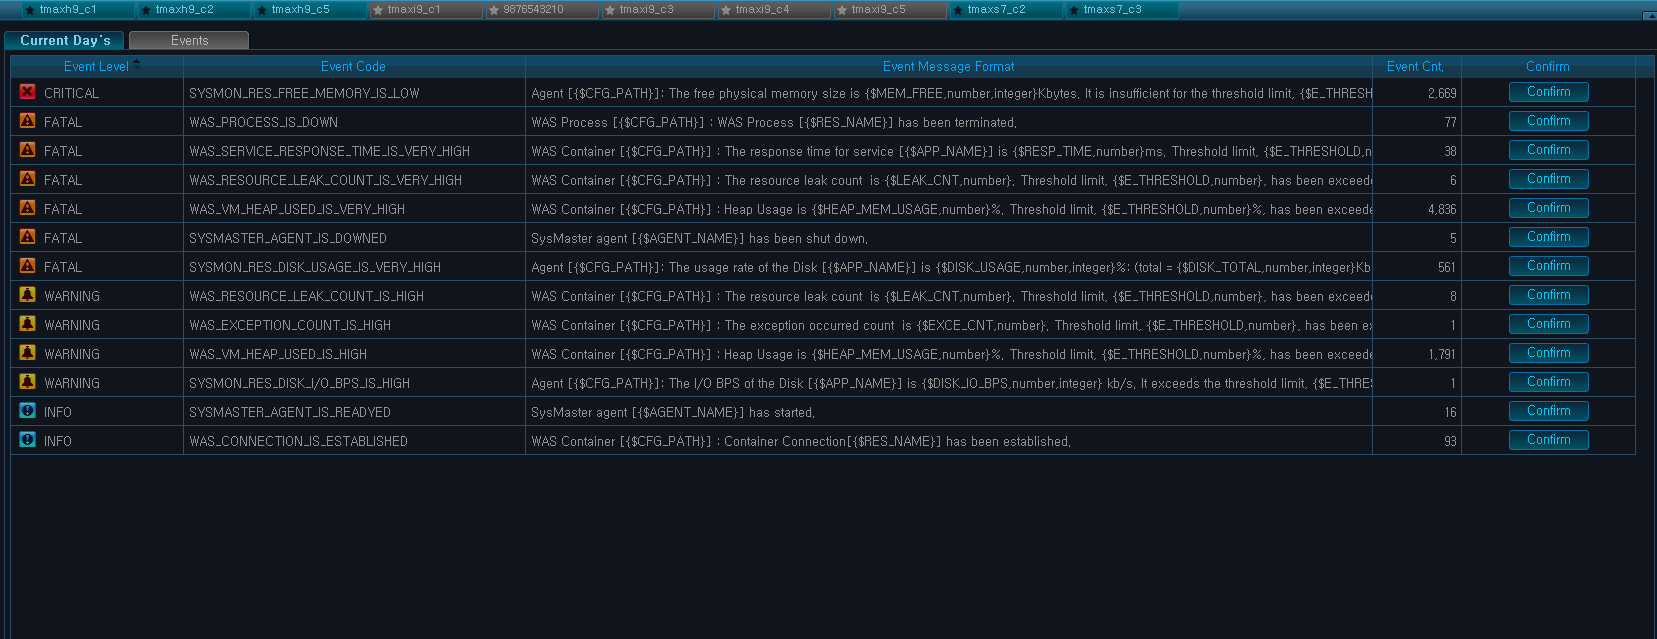
The following is description of the Current Day's Event Status table properties.
| Property | Description |
|---|---|
| Event Level | Event level. (INFO, WARNING, CRITICAL, or FATAL) |
| Event Code | Event code. |
| Event Message Format | Event message format. |
| Event Cnt. | Number of event occurrences. |
| Confirm | Mark the event as being checked. |
[Confirm] is used to mark the event as being checked.
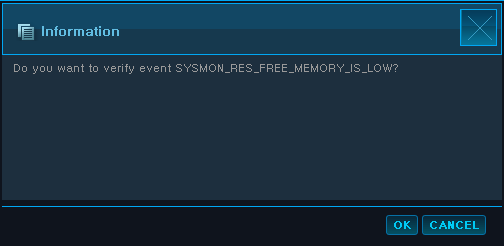
When an event is marked as being checked, it will be removed from the list.
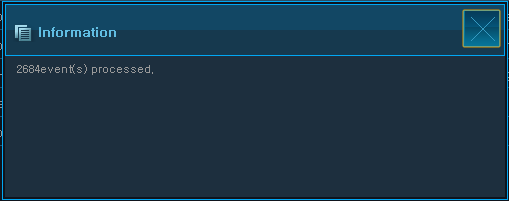
If the confirmed event reoccurs, event count will be reset at 1.
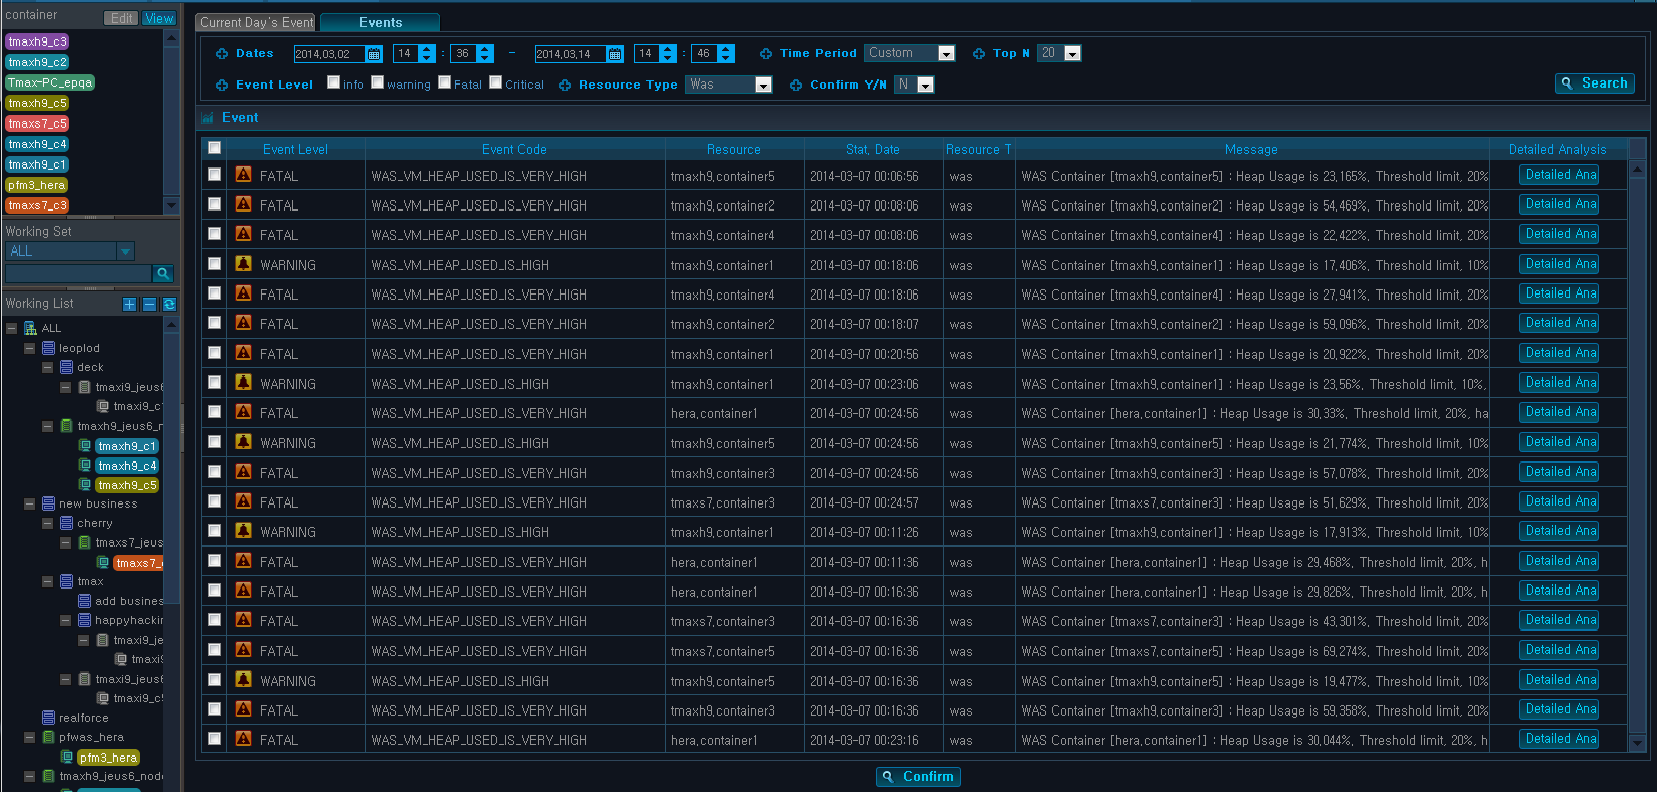
Events display events that match the search criteria.
-
Search Conditions
The following is description of search criteria properties. Enter the criteria, and then click [Search] to display the data.
Property Description Dates Desired time period. Time Period Select one from Last 10 Min, 1 Hr, or 1 Day. Top N Number of rows to display in the Event table. Event Level Event level. Resource Type Resource type. (Was, System) Confirm Y/N Confirm the event. (All, Y, N) -
Event Table
The following is description of the Event table properties.
Property Description Event Level Event level. (INFO, WARNING, CRITICAL, FATAL) Event Code Event code. Resource Resource name. Start Date Date and time of event occurrence. Resource Type Resource type (Was, System). Message Event message. Detailed Analysis Detailed analysis of the event.
To confirm an event, check the checkbox in the first column, and then click [Confirm] at the bottom of the screen. To select all events, check the checkbox in the first column of the header.
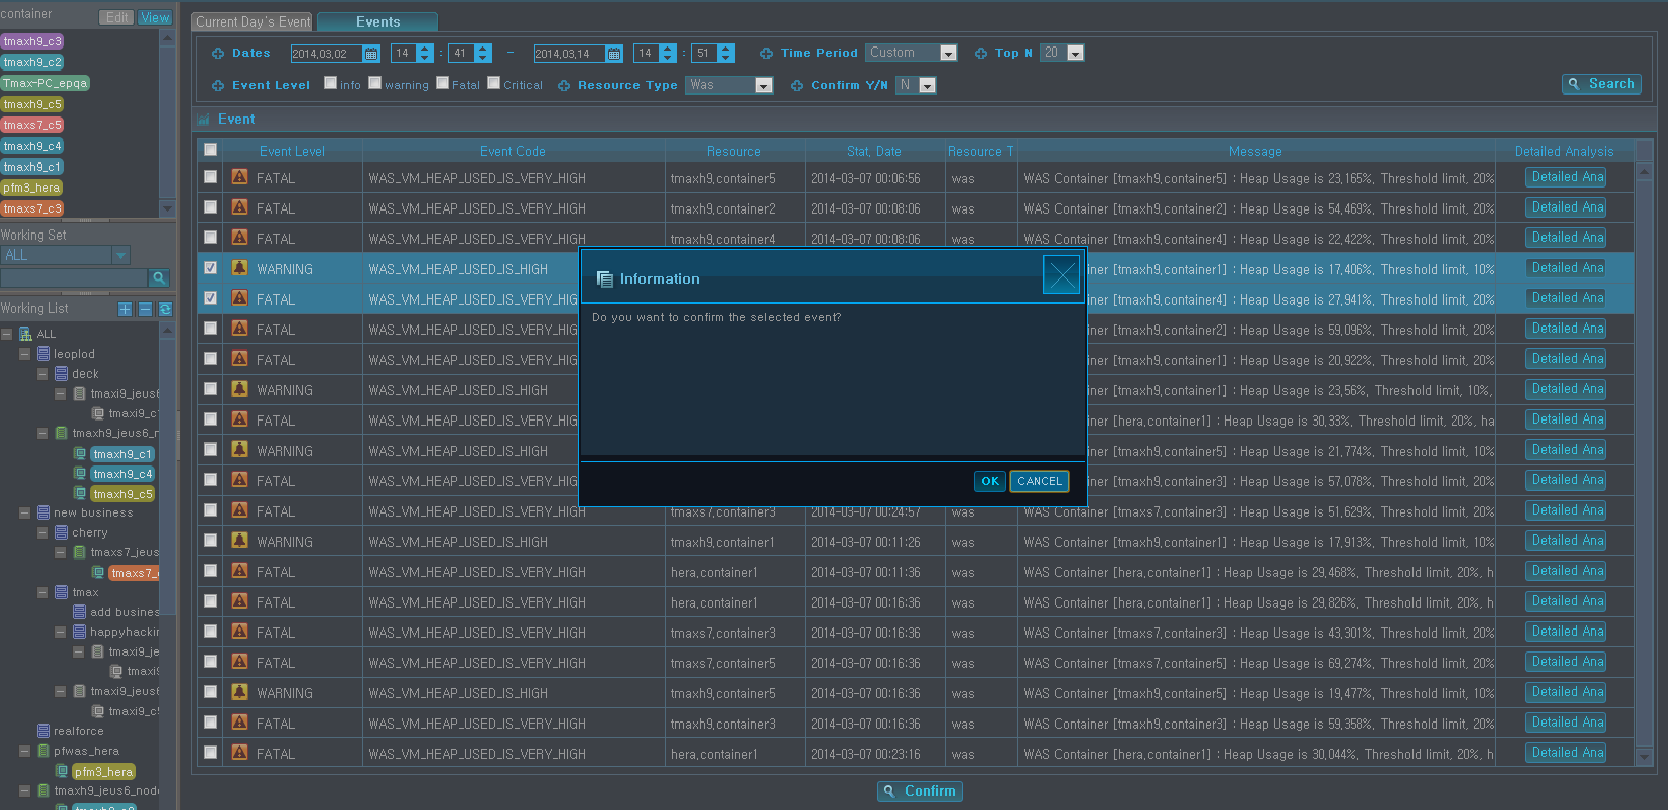
Selected events can be analyzed in detail. Using the mouse, hover over the event to view the event message in a balloon help. Click [Detailed Analysis] to go to the Detailed Analysis screen.
The following is description of the properties displayed for each event.
| Event | Component |
|---|---|
| SysMon Event | [Host CPU Usage(%), Host Memory Usage(mbyte), Swap Memory Usage(mbyte), Disk I/O(bps)] Line Chart |
| Vm Event | [JVM CPU Usage(%), JVM Memory Usage(mbyte), GC Time(s), Available Heap Size(mbyte)] Line Chart |
| Summary Event | [TPS, Avg. Response Time(s), Number of Concurrent Users, Avg. Execution Count] Line Chart |
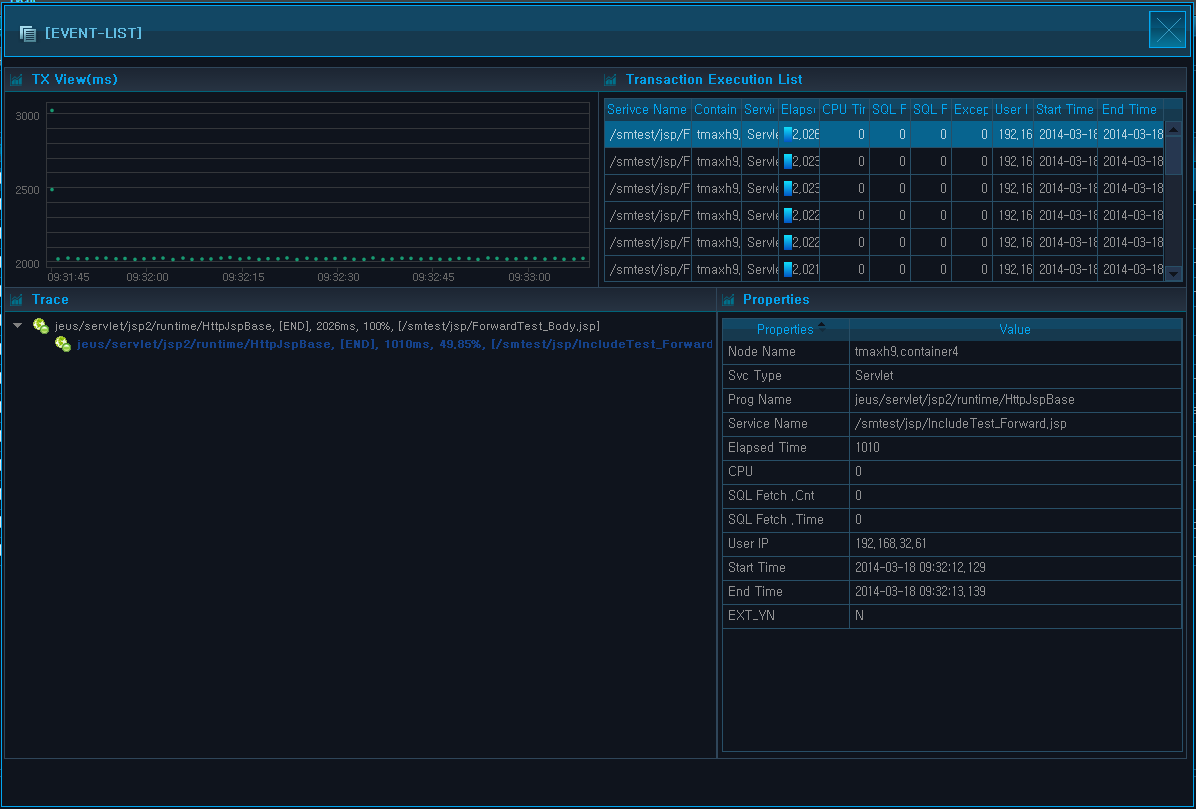
| Service Event | TX View, [Transaction Execution List, Property] Table, Trace |
| Resource Event | [Resource Avg. Response Time (s), Number of Unclaimed Resources, Leak] Line Chart, Service Table. |
| Pool Event | [Thread Pool Use Count, DB Pool Use Count, Pool Use Count] Line Chart, Pool List Table. |