Table of Contents
This chapter describes the Statistics/Reports screen.
Statistics/Reports screen provides various trend analyses for WAS, and displays various comprehensive data.
Statistics/Reports can be accessed from [WAS] > [Statistics/Reports].
Statistics/Reports Menu consists of the following two items.
-
Working List
Multiple containers can be selected from the Working List. For detailed information, refer to "1.4. Working List".
-
Statistics and Reports
Data is displayed in charts and using a summary table by container for the following menus.
Menu Item Description [Top N Trend] Provides daily and monthly service trends. Shows the top 5 services according to the sort order. [Relative Trend] Provides relative daily and monthly service trends of search indicators. [Report] View summary information, and general and business reports.
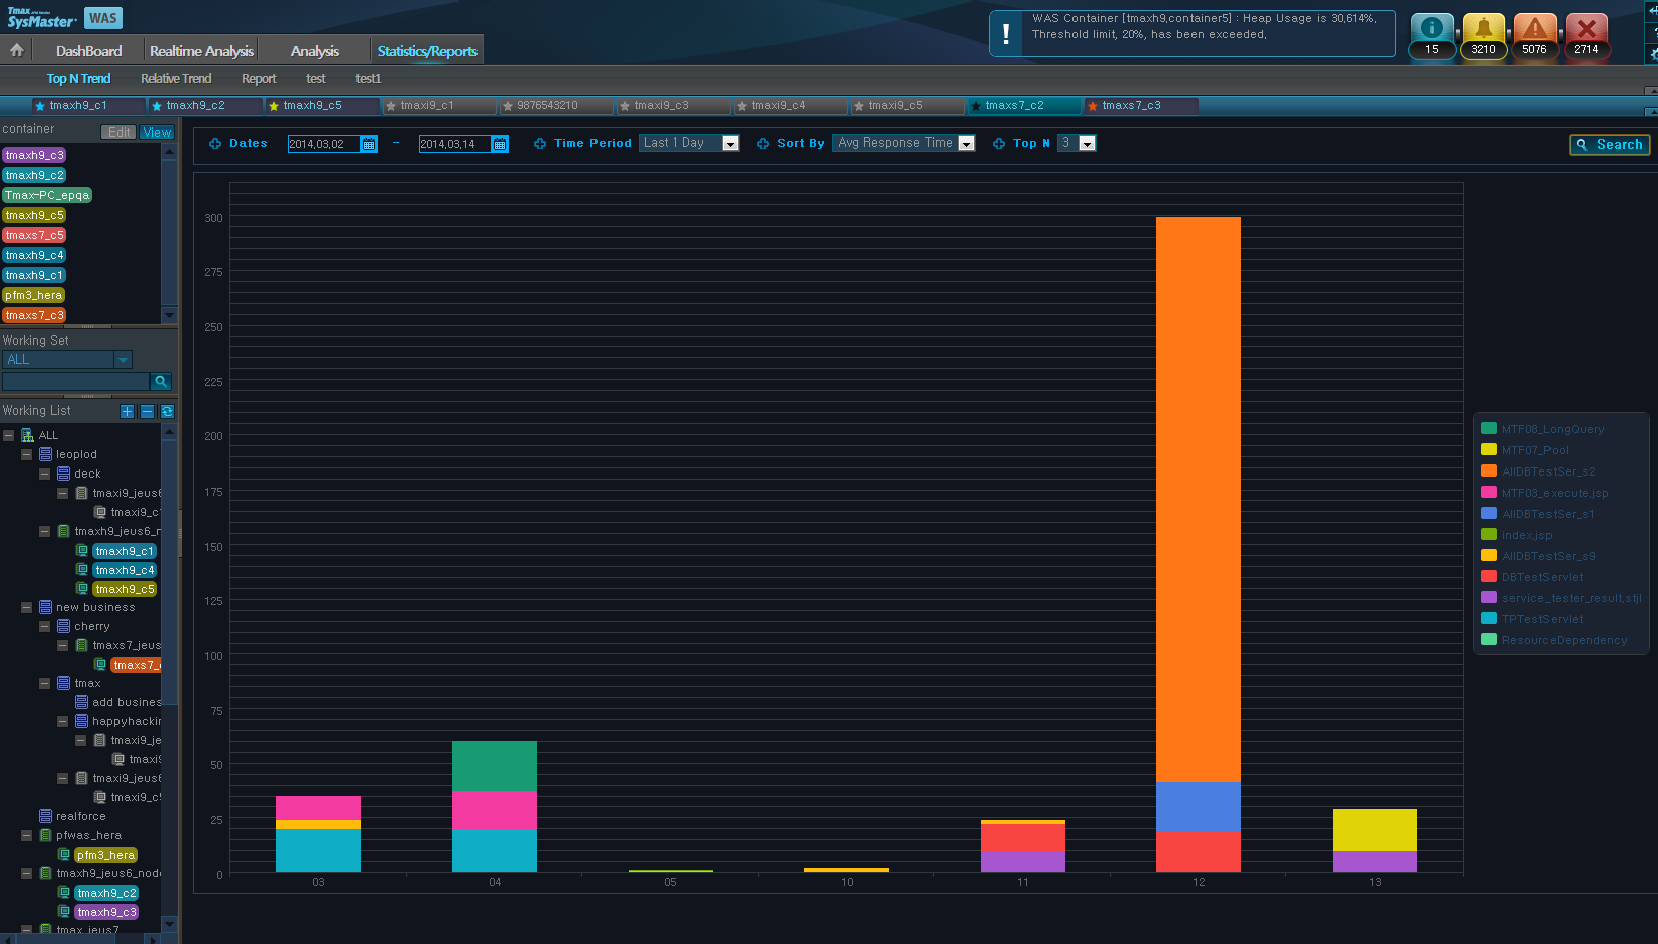
Top N Trend displays top 5 services according to the sort order of the selected container using stacked bar graph.
Top N Trends can be accessed from [WAS] > [Statistics/Reports] > [Top N Trend].
-
Search Criteria
Set the following search criteria, and then click [Search].
Search Criteria Description Search Period Manually enter the 'Dates,' or select a 'Time Period'. 'Time Period' options include "Last 1 Day" or "Last 1 Month." Default value is "Last 1 Day."
When "Last 1 Day" is selected, Trend Analysis is performed for the period between 01:00 and 24:00 of the previous day, and for the last month when "Last 1 Month" is selected.
Sort By Select one of Avg Response Time, Success Cnt, or Fail Cnt. -
Chart
X axis shows the selected time period, and Y axis changes according to sort the value. If Avg Response Time is selected, Y axis shows time value in sec. and an integer value for the others. The legend contains the service names in different colors.
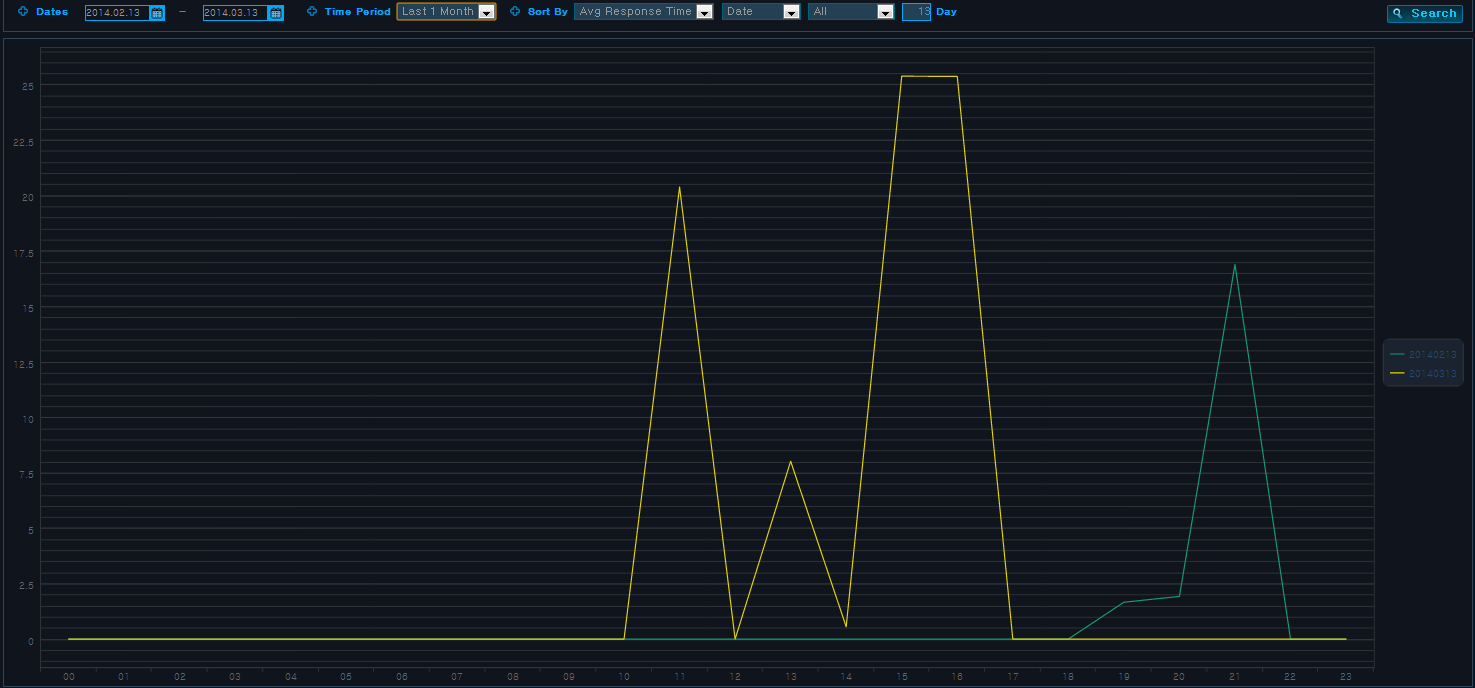
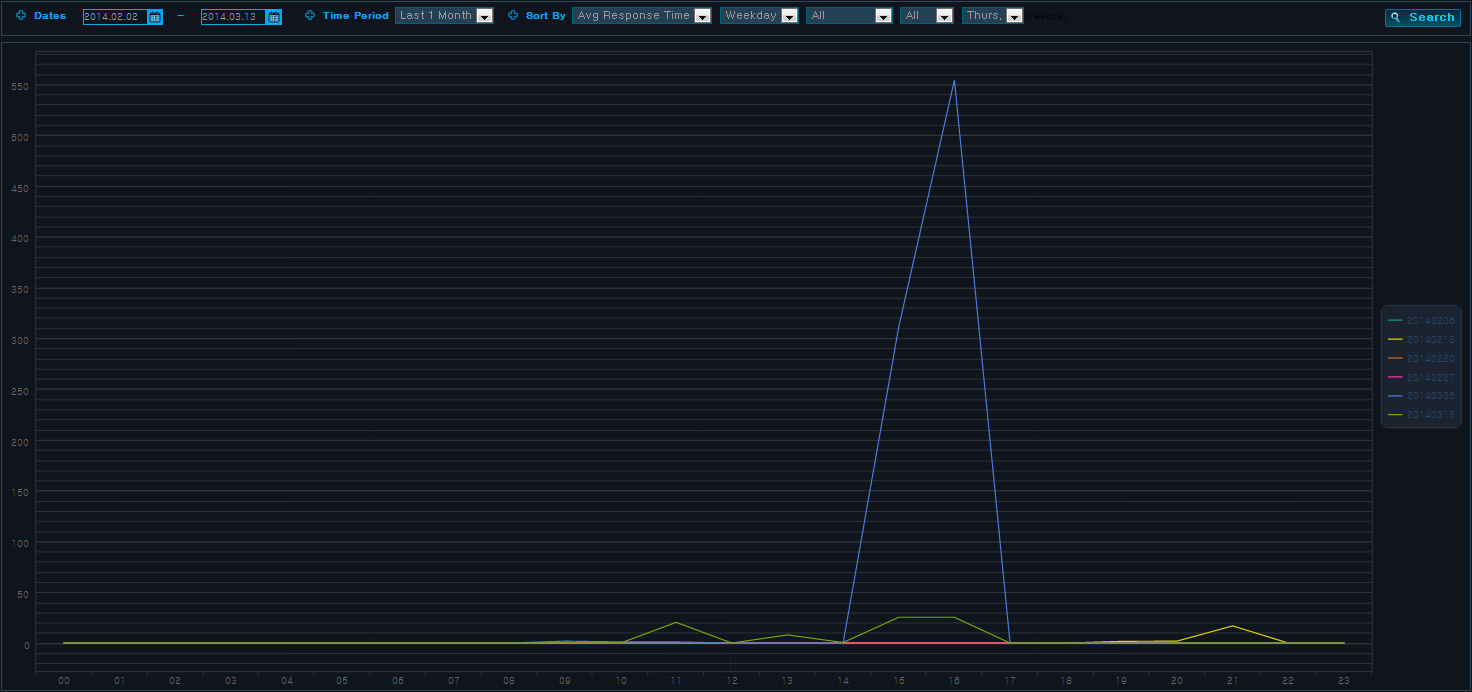
Relative Trend displays daily service data for the selected container in the Working List by selecting a sort criteria (Avg Response Time, Success Cnt, Fail Cnt). Trends are analyzed for each day using a bar chart
Trend analysis considers one day as from 00:00 to 23:00. For example, the following chart can be used to analyze the trends of Avg Response Time for Mondays in July.
Relative Trend can be accessed from [WAS] > [Statistics/Reports] > [Relative Trend].
-
Search Criteria
Set the following search criteria, and then click [Search].
Search Criteria Description Search Period Manually enter the 'Dates,' or select a 'Time Period'. 'Time Period' options include "Last 1 Month" or "Last 1 Year." Default value is "Last 1 Month."
When "Last 1 Month" is selected, Trend Analysis is performed for the last month, and for the last year when "Last 1 Year" is selected.
Sort By Select one of Avg Response Time, Success Cnt, or Fail Cnt. -
Chart
X axis shows the time period between 0:00 and 23:00, and Y axis changes according to the sort value. If Avg Response Time is selected, Y axis shows time value in sec. and number for the others. The legend contains the dates of Mondays in July, and each represents Avg Response Time data for the time period between 0:00 and 23:00.
Report displays tables of past data which can be saved as excel files.
Report can be accessed from [WAS] > [Statistics/Reports] > [Report] and consists of the following tabs.
-
[General Report]
-
[Business Report]
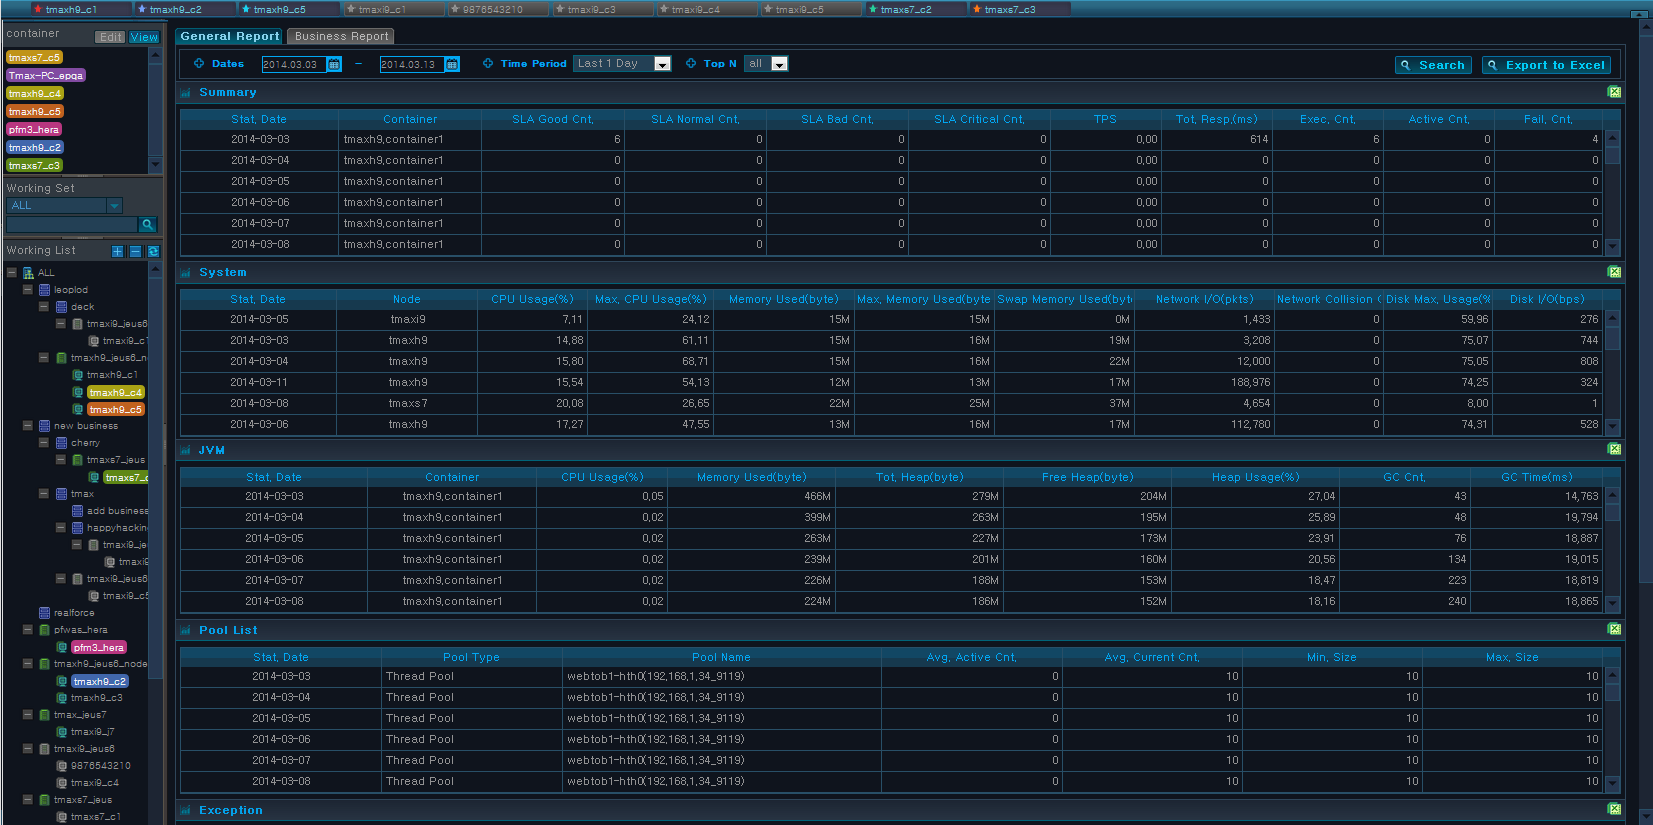
General Report displays tables of Summary, System, JVM, Pool List, Exception, and Error Event.
All tables can be exported to excel by clicking [Export to Excel].
-
Search Criteria
Set the following search criteria, and then click [Search].
Search Criteria Description Search Period Manually enter the 'Dates,' or select a 'Time Period'. 'Time Period' options include "Last 1 Day" or "Last 1 Month."
Time Period Select 'Last 1 Day' or 'Last 1 Month'.
-
Last 1 Day: Displays 24 hours in units of an hour.
-
Last 1 Month: Displays 1 month in units of a day.
TOP N Set the maximum number of rows for the table.
Default value is 'all.' Other options include 20, 50, 100, and 300.
Top N sorts the data by 'Stat. Date'. Date in ascending order.
-
-
Summary
Summary table displays container summary data.
Property Description Stat. Date Date and time when container data was retrieved. Container Container name. SLA Good Cnt. Number of services with Good response time according to SLA. SLA Normal Cnt. Number of services with Normal response time according to SLA. SLA Bad Cnt. Number of services with Bad response time according to SLA. SLA Critical Cnt. Number of services with Critical response time according to SLA. TPS Number of services processed per second. Tot. Resp.(ms) Total service response time. Exec. Cnt. Number of service executions. Succ. Cnt. Number of successfully processed services. Active Cnt. Number of active services. Fail. Cnt. Number of failed services. -
System
System table displays system data.
Property Description Stat. Date Date and time when node data was retrieved. Node Node name. CPU Usage(%) CPU usage. Max. CPU Usage(%) Max CPU usage. Memory Used(byte) Memory usage. Max. Memory Used(byte) Max memory usage. Swap Memory Used(byte) Swap memory usage. Network I/O(pkts) Network Packet I/O. Network Collision Cnt. Network collision count. Disk Max. Usage(%) Max disk usage. Disk I/O(bps) Disk I/O (bits per second). -
JVM
JVM table displays JVM data.
Property Description Stat. Date Date and time when container data was retrieved. Container Container name. CPU Usage(%) JVM CPU usage. Memory Used(byte) JVM memory usage. Tot. Heap(byte) JVM heap memory size. Free Heap(byte) Available JVM heap memory size. Heap Usage(%) JVM heap memory usage. GC Cnt. Number of times spent in Garbage Collection. GC Time(ms) Time spent in Garbage Collection. -
Pool List
Pool List table displays pool data.
Property Description Stat. Date Date and time when container data was retrieved. Pool Type Pool type. (DB Pool, Thread Pool) Pool Name Pool name. Avg. Active Cnt. Average number of active threads. Avg. Current Cnt. Average number of current threads. (Avg. Active Cnt. + Avg. Idle Cnt.) Min. Size Min pool size. Max. Size Max pool size. -
Exception
Exception table displays exception data.
Property Description Stat. Date Date and time when container data was retrieved. Exception Name Exception name. Container Name of the container where exception occurred. Exception Cnt. Number of exception occurrences. -
Error Event
Error event table displays error event data.
Property Description Container Container name. Event Event name. Event Level Event level. (INFO, WARNING, CRITICAL, FATAL) Event Cnt. Number of event occurrences.
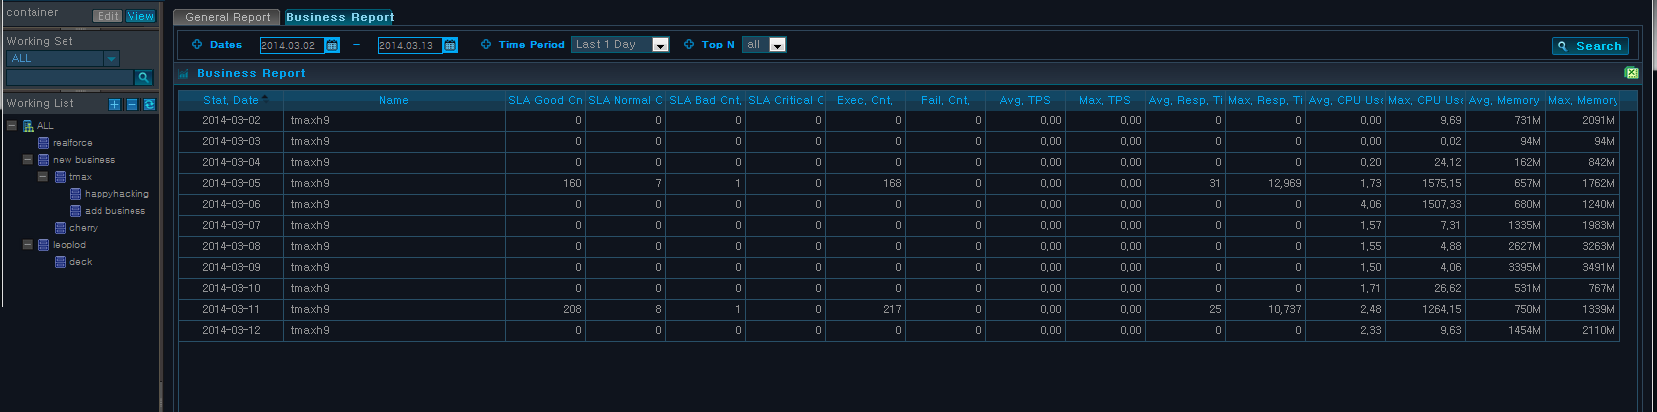
Business Report displays data for selected business in a table.
-
Search Criteria
Set the following search criteria, and then click [Search].
Search Criteria Description Search Period Manually enter the 'Dates,' or select a 'Time Period'. 'Time Period' options include "Last 1 Day" or "Last 1 Month."
Time Period Select 'Last 1 Day' or 'Last 1 Month'.
-
Last 1 Day: Displays 24 hours in units of an hour.
-
Last 1 Month: Displays 1 month in units of a day.
TOP N Set the maximum number of rows for the table.
Default value is 'all.' Other options include 20, 50, 100, and 300.
Top N sorts the data by 'Stat. Date'. Date in ascending order.
-
-
Business Report
The following is description of Business Report table properties.
Property Description Stat. Date Date and time when business data was retrieved. Name Business name. SLA Good Cnt. Number of services with Good response time according to SLA. SLA Normal Cnt. Number of services with Normal response time according to SLA. SLA Bad Cnt. Number of services with Bad response time according to SLA. SLA Critical Cnt. Number of services with Critical response time according to SLA. Exec. Cnt. Number of service executions. Fail. Cnt. Number of failed service. Avg. TPS Average number of services processed per second. Max. TPS Max number of services processed per second. Avg. Resp. Time(ms) Average service response time. Max. Resp Time(ms) Max service processing time. Avg. CPU Usage(%) Average CPU usage. Max. CPU Usage(%) Max CPU usage. Avg. Memory Used(byte) Average memory usage. Max. Memory Used(byte) Max memory usage.