Table of Contents
This chapter describes the Detailed Analysis screen.
Analysis screen queries and analyzes past data of servers and WASs that are registered in SysMaster.
Analysis can be accessed from [WAS] > [Analysis].
Analysis Menu consists of the following two items.
-
Working List
Multiple containers can be selected from the Working List. For detailed information, refer to "1.4. Working List".
-
Analysis
Data is displayed in charts and using a summary table by container for the following menus.
Menu Item Description [Summary] Displays JVM data, throughput, user data, service execution data, and error event charts for the selected time period. [TX View] Displays current transaction's distribution over the selected time period. [Service] Displays service, SQL, exception, and external transaction data for the selected time period. [Infra] Displays JVM, java pool, unclaimed resource, JNDI, and host data for the selected time period. [Event] Displays event occurrence status, list, and trends for the selected time period. [Visitor] Displays user related charts for the selected time period.
Search Condition
Analysis Menu uses a common time period search condition to retrieve data. By default, all screens of Analysis Menu display data for the last 10 minutes.
The following is the common search condition input section.

The search condition can be set by entering the date and time fields of 'Dates' or by selecting an option from the 'Time Period' dropdown list.
By default, 'Time Period' is set to "Last 10 Min." Other options include "Last 1 Hr," "Last 1 Week," and "Last 1 Month." TX View is provided for only last 1 day. When an option is selected, the 'Dates' fields are automatically filled in using the current time as the start time. After setting the search condition, click [Search].
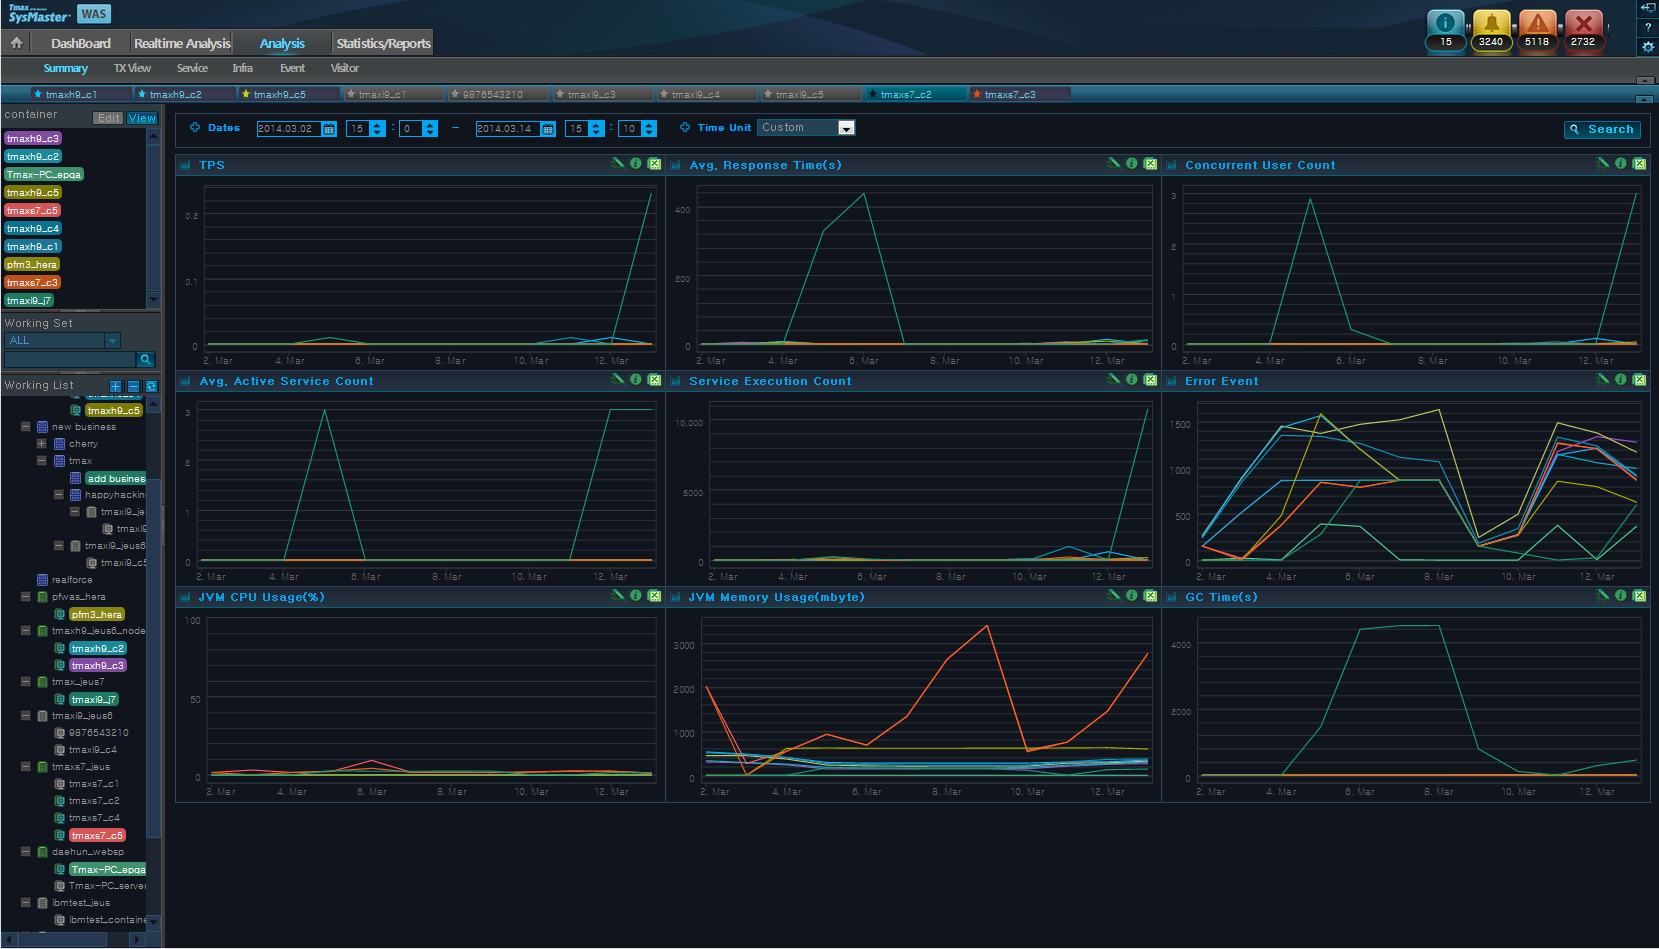
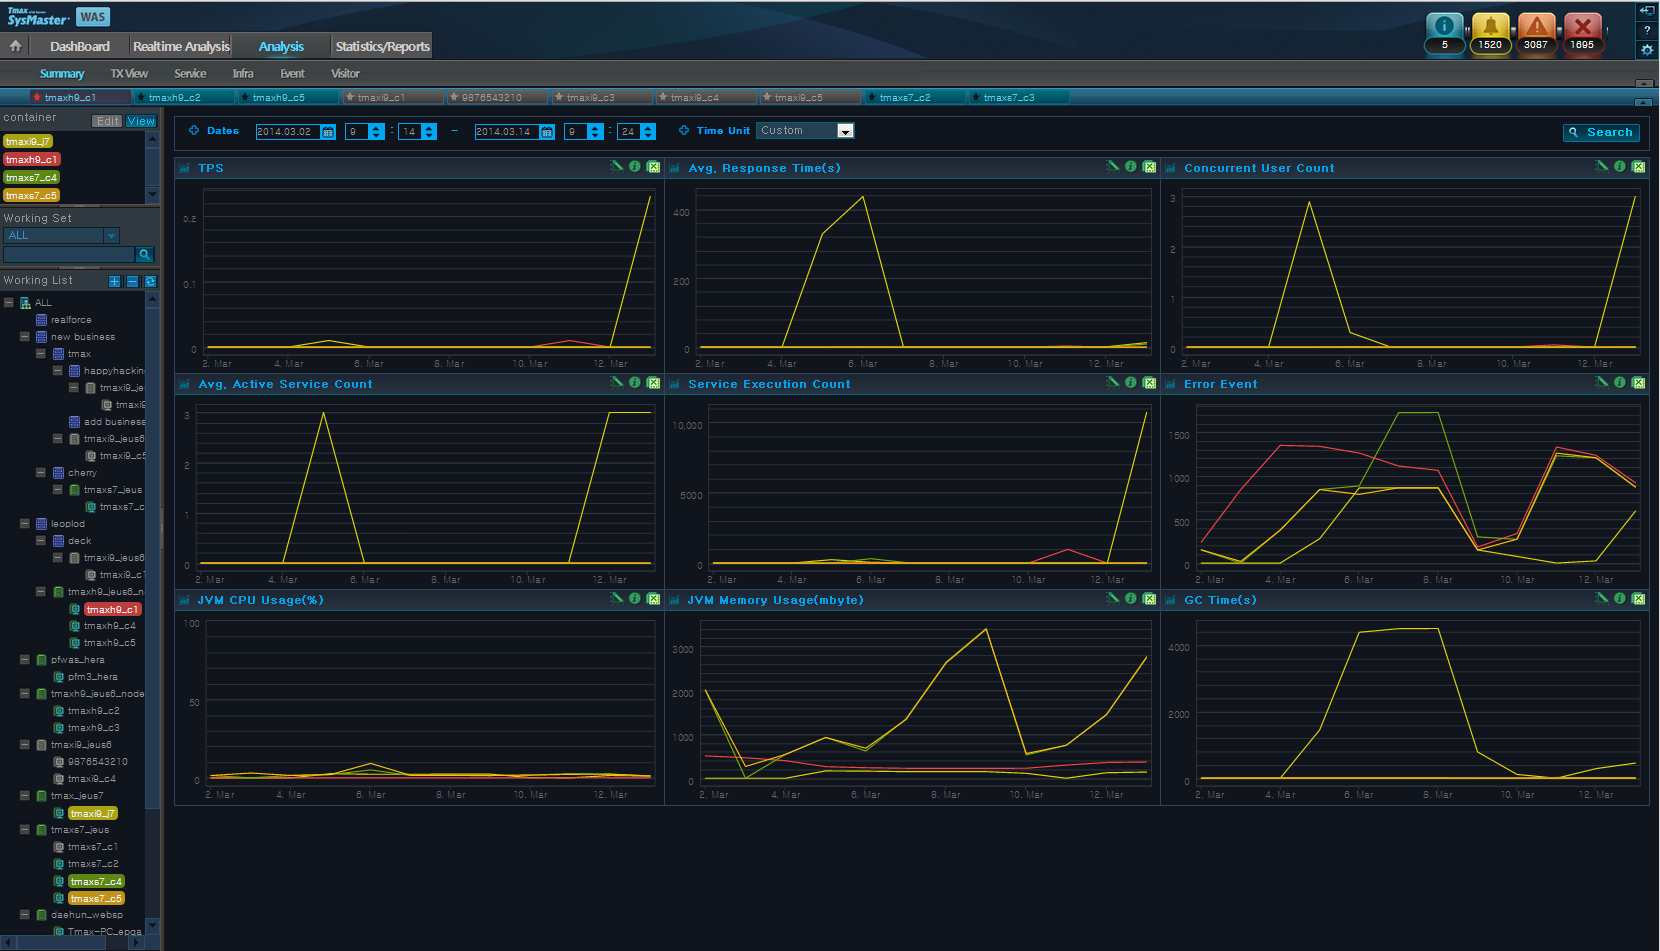
Summary displays charts for JVM data, throughput, user data, service execution data, and error event occurrence count of the selected containers. Click on any value on the chart to move to the relevant Analysis screen. Summary screen, by default, displays data for the last 10 minutes.
Summary can be accessed from [WAS] > [Analysis] > [Summary].
-
Search Condition
Set the following search condition, and then click [Search].
Search Condition Description Search Period Manually enter the 'Dates,' or select a 'Time Period'. By default, 'Time Period' is set to "Last 10 Min." Other options include "Last 1 Hr," "Last 1 Week," and "Last 1 Month." -
Working List
The charts display data for the selected containers in the Working List.
Chart Description TPS Transactions per second for the selected container(s) in the Working List.
(X axis: Selected Time Period, Y axis: Transactions Per Second)
Avg. Response Time(s) Average service response time for the selected container(s) in the Working List.
(X axis: Selected Time Period, Y axis: Avg. Response Time(s))
Concurrent User Count Number of concurrent users per container.
Since HTTP protocol does not maintain connections with users, the following equation based on the performance theory is used to determine the number of concurrent users.
ConcurrentUser = Throughput(tps) * {Resp.Time(sec) + ThinkTime(sec)}(X axis: Selected Time Period, Y axis: Number of Concurrent Users)
Avg. Active Service Count Average number of active services for the selected container(s) in the Working List.
(X axis: Selected Time Period, Y axis: Active Service Count)
Service Execution Count Number of service executions for the selected container(s) in the Working List.
(X axis: Selected Time Period, Y axis: Service Execution Count)
Error Event Number of error event occurrences for the selected container(s) in the Working List.
(X axis: Selected Time Period, Y axis: Error Event Count)
JVM CPU Usage (%) JVM CPU Usage for the selected container(s) in the Working List.
(X axis: Selected Time Period, Y axis: JVM CPU Usage(%))
JVM Memory Usage (mbyte) JVM memory usage for the selected container(s) in the Working List.
(X axis: Selected Time Period, Y axis: JVM Memory Usage (MB))
GC Time (s) Time spent in Garbage Collection for the selected container(s) in Working List.
(X axis: Selected Time Period, Y axis: GC Time(s))
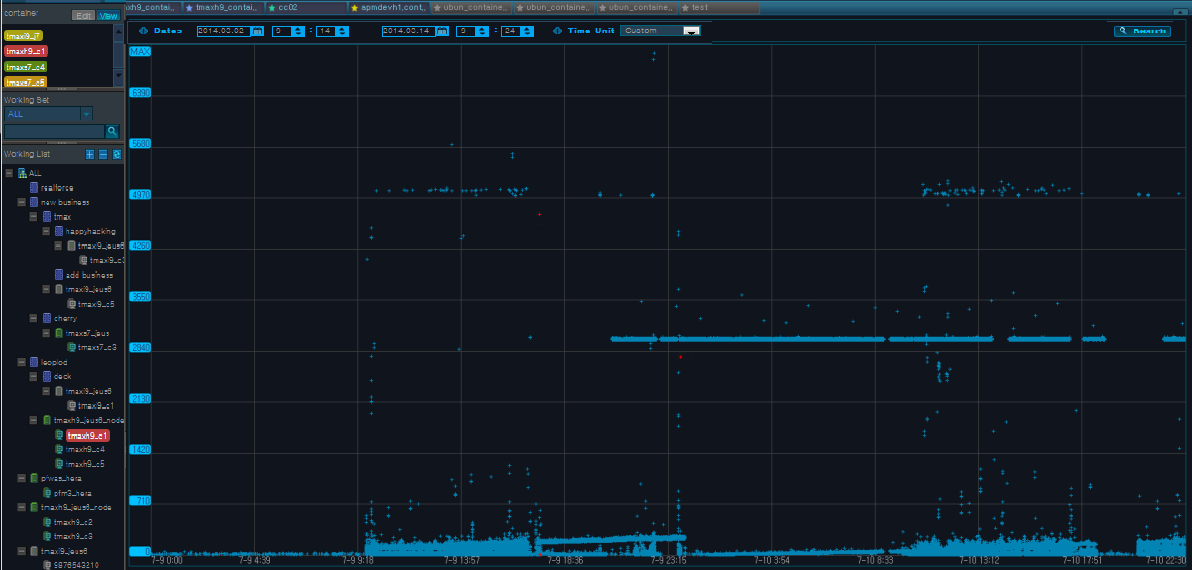
Based on the search condition, TX View displays transactions processed per unit of time (ms) using scatter plot to show distribution of the transaction over multiple containers.
TX View can be accessed from [WAS] > [Analysis] > [TX View].
-
Search Condition
Set the following search condition, and then click [Search].
Search Condition Description Search Period Manually enter the 'Dates,' or select a 'Time Period'. By default, 'Time Period' is set to "Last 10 Min." Other options include "Last 1 Hr," "Last 1 Week," and "Last 1 Month."
-
TX View
Y axis shows the Elapsed Time(ms). When a Y axis value is clicked, data is displayed with the selected value as the max Y axis value. TX View displays data in 3 different colors. Normal transaction is in blue, resource leak is in yellow, and exception is in red.
Use Drag & Drop method on a desired area to display detailed data.
For detailed information about TX View, refer to "TX View" in "2.4. Real-Time Dashboard".
Service displays data related to service, SQL, exception, and external transaction for one or more selected containers.
Service can be accessed from [WAS] > [Analysis] > [Service] and consists of the following tabs.
-
[Top N]
-
[Service]
-
[SQL]
-
[Exception]
-
[External Transaction]
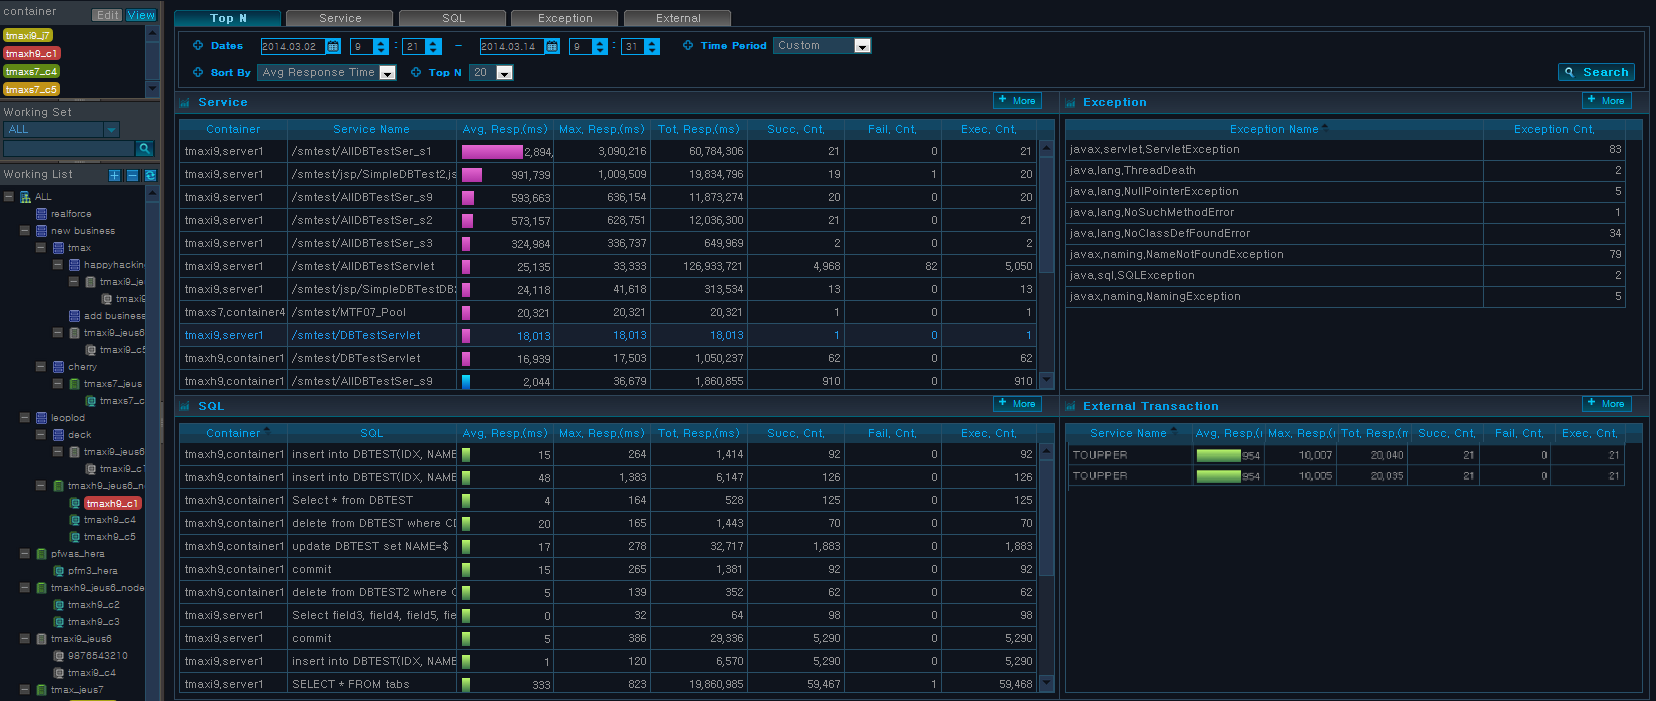
Top N displays a sorted table of currently active services, SQLs, exceptions, and external transactions for each container.
Select a service row to view the service trace and properties. Since too many transactions can be displayed with a search condition that results in transaction drill-down, the maximum time period search condition is a day.
Click [+ More] from each table to move to the related tab to see more detailed information.
-
Search Condition
Set the following search condition, and then click [Search].
Search Condition Description Search Period Manually enter the 'Dates,' or select a 'Time Period'. By default, 'Time Period' is set to "Last 10 Min." Other options include "Last 1 Hr," "Last 1 Week," and "Last 1 Month." Sort By Data is displayed in a table sorted in descending order of a sort item (Avg Response Time, Success Cnt, Fail Cnt). (Note that the Exception Table is not affected by the sort criteria)
Service
Displays service execution data. Select a service row to view its trace data and properties.
| Property | Description |
|---|---|
| Service Name | Request name that identifies the service. (JSP URL, EJB Method, etc.) |
| Avg. Resp.(ms) | Average service response time. |
| Max. Resp.(ms) | Max Service response time. |
| Tot. Resp.(ms) | Total service response time. |
| Succ. Cnt. | Number of successful executions of the service. |
| Fail. Cnt. | Number of failed executions of the service. |
| Exec. Cnt. | Number of service executions. |
SQL
Displays SQL execution list when service is executed.
| Property | Description |
|---|---|
| SQL | Currently executing SQL. |
| Avg. Resp.(ms) | Average SQL response time. |
| Max. Resp.(ms) | Max SQL response time. |
| Tot. Resp.(ms) | Total SQL response time. |
| Succ. Cnt. | Number of successful executions of the SQL. |
| Fail. Cnt. | Number of failed executions of the SQL. |
| Exec. Cnt. | Number of SQL executions. |
External Transaction
Displays external transaction data that is received during TP.
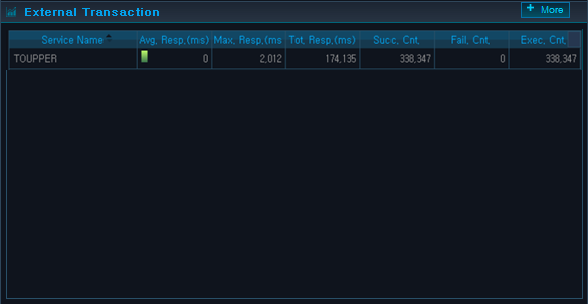
| Property | Description |
|---|---|
| Service Name | Service name. |
| Avg. Resp.(ms) | Average service response time. |
| Max. Resp.(ms) | Max service response time. |
| Tot. Resp.(ms) | Total service response time. |
| Succ. Cnt. | Number of successful executions of the service. |
| Fail. Cnt. | Number of failed executions of the service. |
| Exec. Cnt. | Number of service executions. |
Exception
Displays a list of Java EE exception types (SQLException, NullPointException, ServletException, SocketException, FileIOException, etc.) and their number of occurrences (Note that only the exceptions that are thrown are handled here).
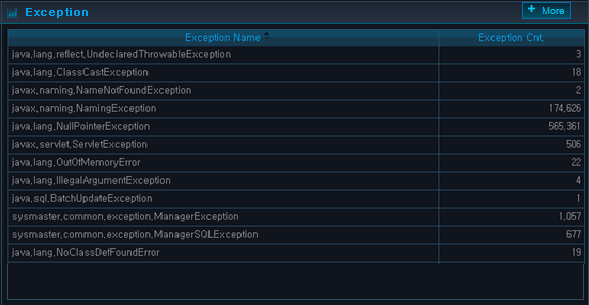
| Property | Description |
|---|---|
| Exception Name | Exception Name. |
| Exception Cnt. | Number of exception occurrences. |
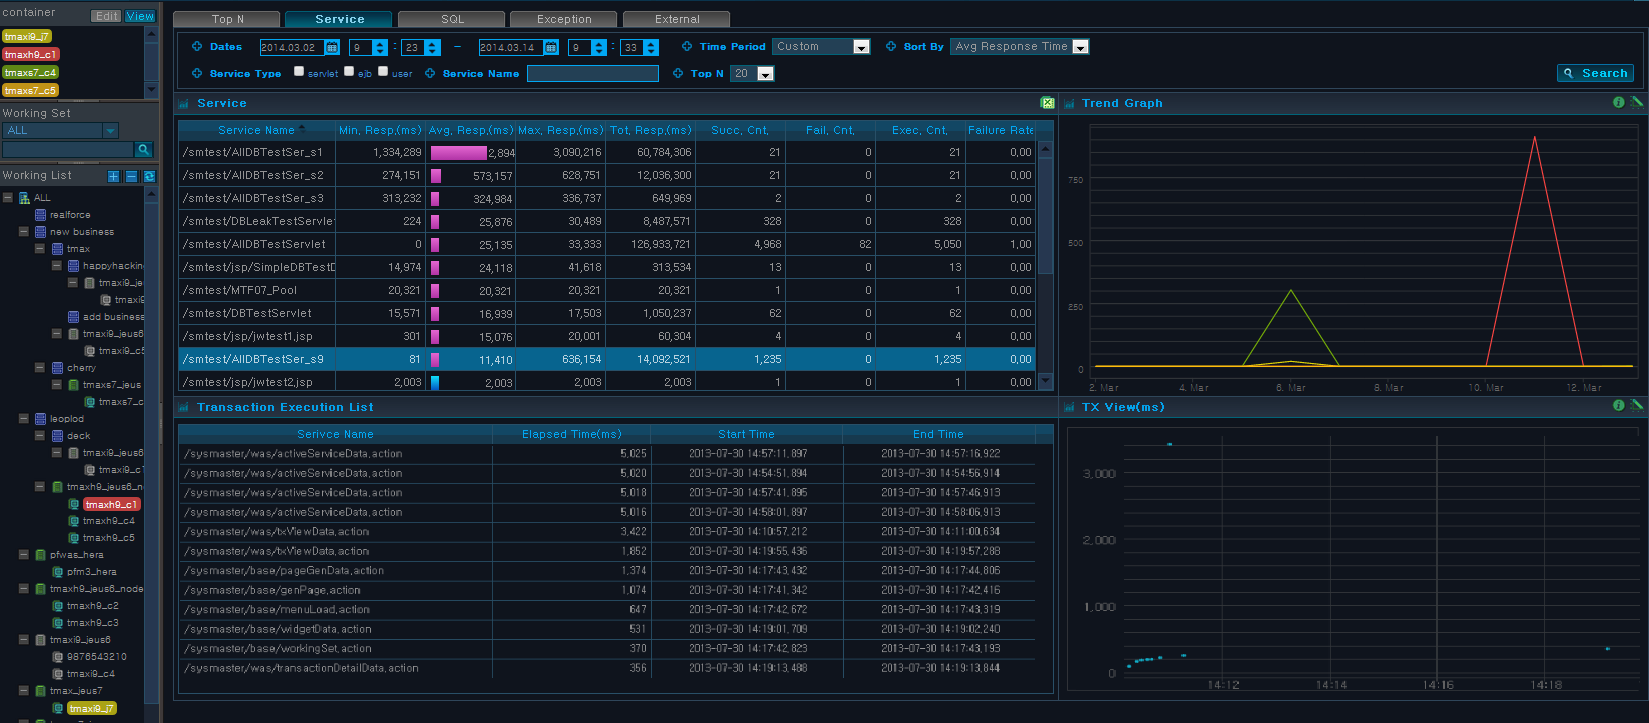
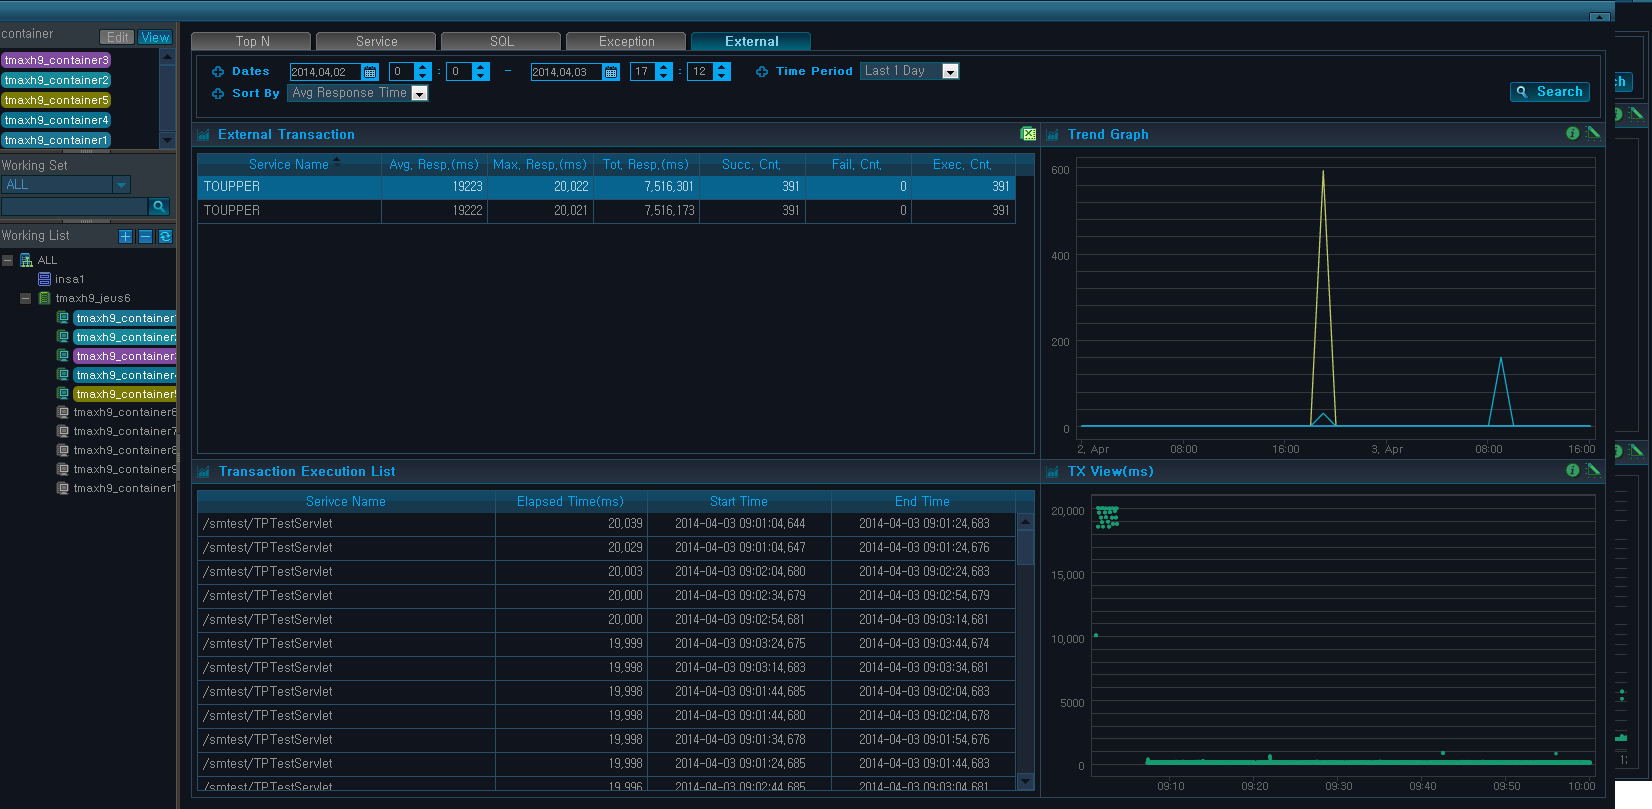
Service displays service history of one or more selected containers, and Trend Graph for the services. When a value is selected from the Trend Graph, Transaction Execution List and TX View(ms) for the selected time period is displayed.
-
Search Condition
Set the following search condition, and then click [Search].
Search Condition Description Search Period Manually enter the 'Dates,' or select a 'Time Period'. By default, 'Time Period' is set to "Last 10 Min." Other options include "Last 1 Hr," "Last 1 Week," and "Last 1 Month." Sort By Data is displayed in a table sorted in descending order of a sort item (Avg Response Time, Success Cnt, Fail Cnt). Service Type Select one of servlet, ejb, or user property. Service Name Service name to search for. Finds all services with all or part of the search text. Top N Number of rows to display in each table. Select one of 20, 50, 100, 300, or all.
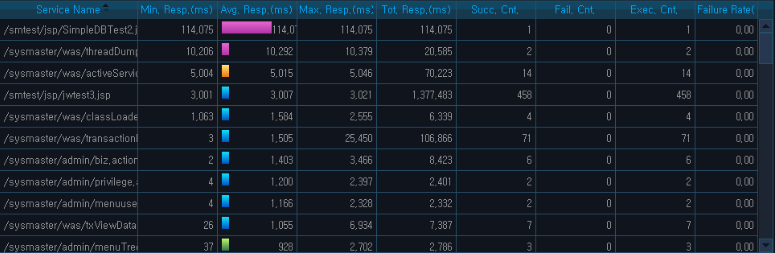
Service Table
The following is description of the Service Table properties.
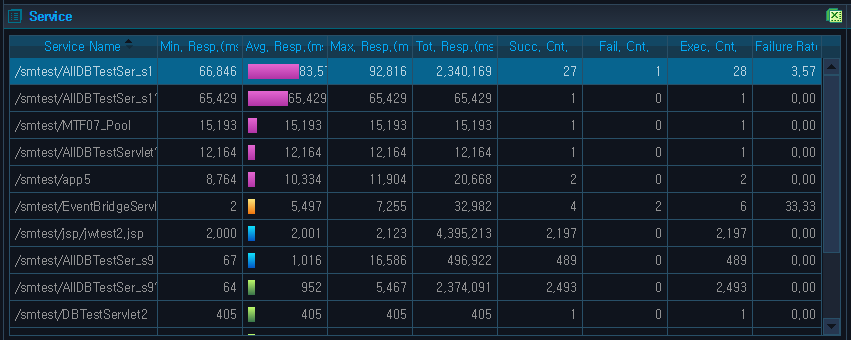
| Property | Description |
|---|---|
| Service Name | Request name that identifies the service. (JSP URL, EJB Method, etc.) |
| Min. Resp.(ms) | Min service processing time. |
| Avg. Resp.(ms) | Average service response time. |
| Max. Resp.(ms) | Max service processing time. |
| Tot. Resp.(ms) | Total service processing time. |
| Succ. Cnt. | Number of successful executions of the service. |
| Fail. Cnt. | Number of failed executions of the service. |
| Exec. Cnt. | Number of service executions. |
| Failure Rate(%) | Failure rate of the requested service. |
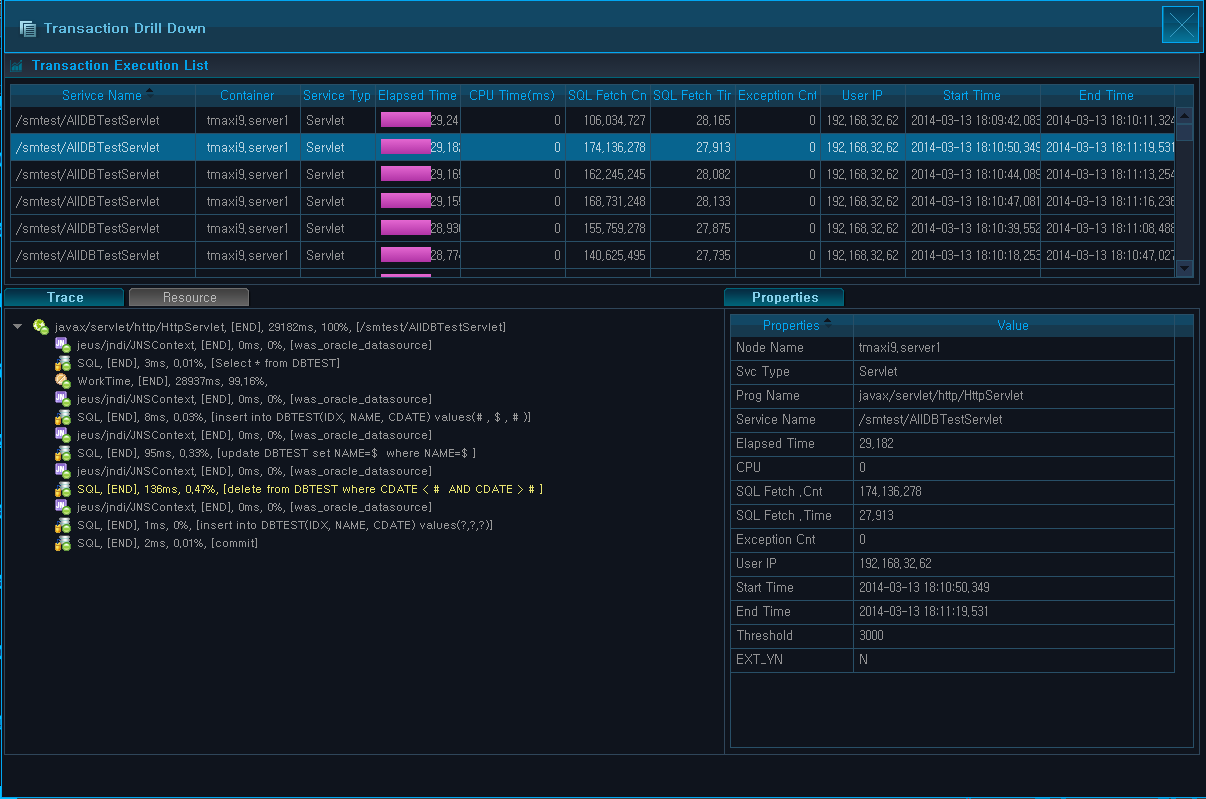
Transaction Execution List
When a row is selected from the Service Table, related Trend Graph is displayed. When a time is selected from the Trend Graph, Transaction Execution List is displayed for the selected time.
The following is description of Transaction Execution List Table properties. When a table row is selected, a popup window with drill-down Transaction Execution List is displayed.
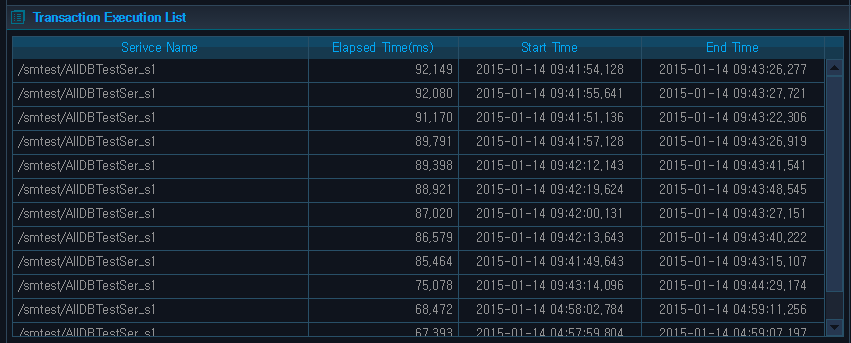
| Property | Description |
|---|---|
| Service Name | Request name that identifies the service. (JSP URL, EJB Method, etc.) |
| Elapsed Time(ms) | Duration of service execution. |
| Start Time | Service start date and time. |
| End Time | Service termination date and time. |
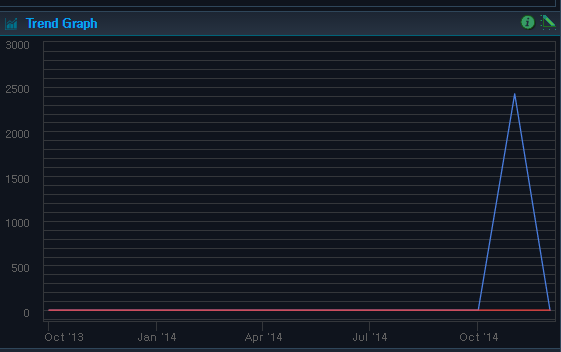
Trend Graph
Analyzes service trends of the selected containers in the Working List. X axis shows date and time of the search period, and the Y axis shows the number of successfully processed services.

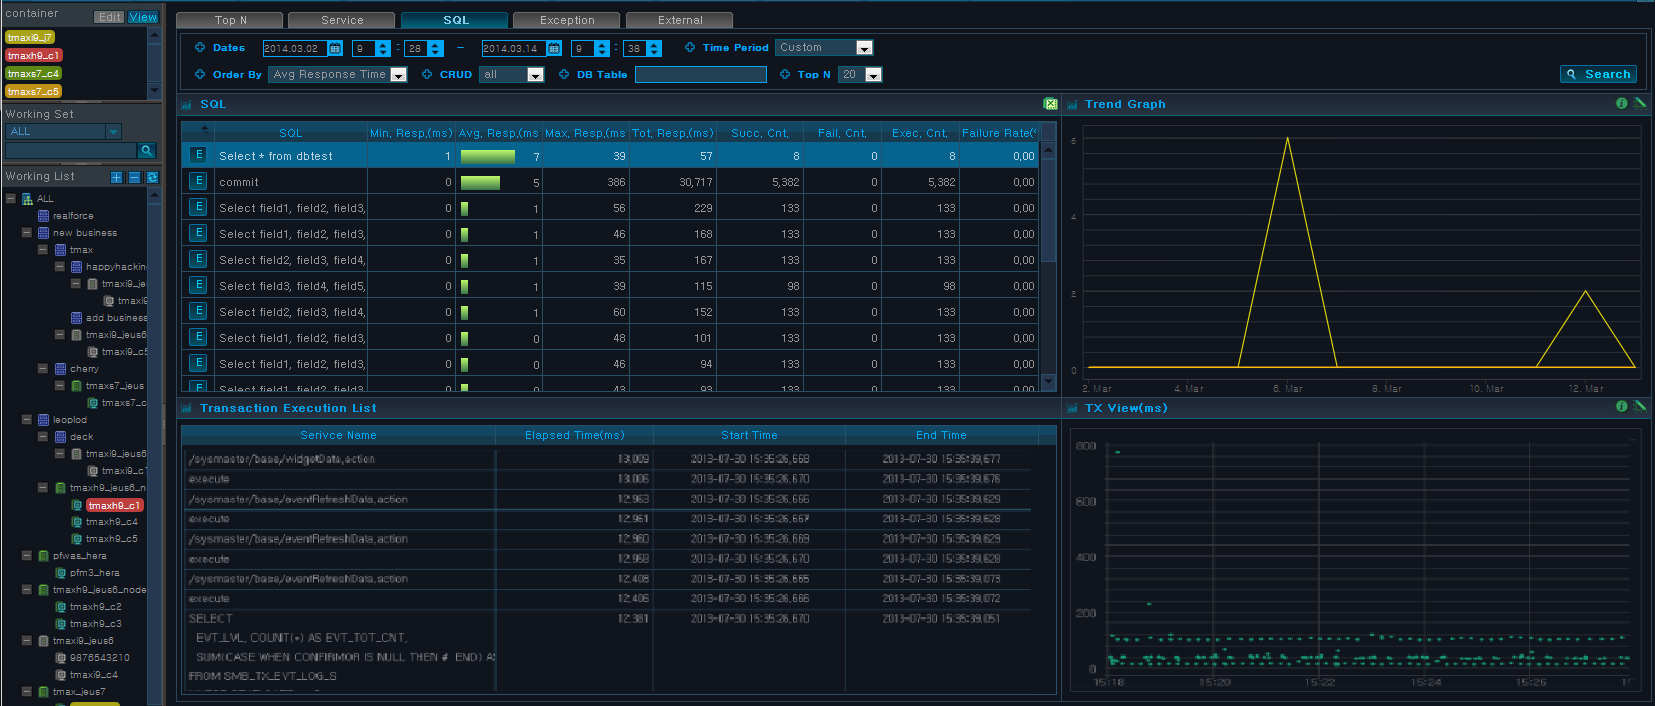
SQL displays SQL queries of one or more selected containers and Trend Graph and Transaction Execution List for the related services.
When a value is selected from the Trend Graph, Transaction Execution List and TX View(ms) for the selected time period is displayed.
-
Search Condition
Set the following search condition, and then click [Search].
Search Condition Description Search Period Manually enter the 'Dates,' or select a 'Time Period'. By default, 'Time Period' is set to "Last 10 Min." Other options include "Last 1 Hr," "Last 1 Week," and "Last 1 Month." Sort By Data is displayed in a table sorted in descending order of a sort item (Avg Response Time, Success Cnt, Fail Cnt). CRUD Select one of CRUD properties (select, insert, delete, update). Searches for queries using the selected CRUD property. DB Table Table name to search for. Finds all tables with all or part of the search text. Top N Number of rows to display in each table. Select one of 20, 50, 100, 300, or all.
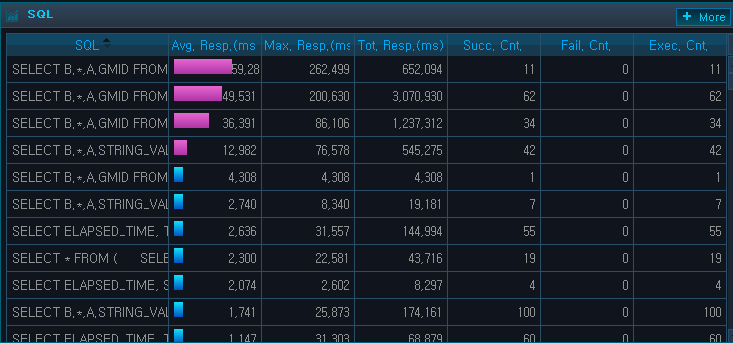
SQL Table
The following is description of the SQL Table properties.
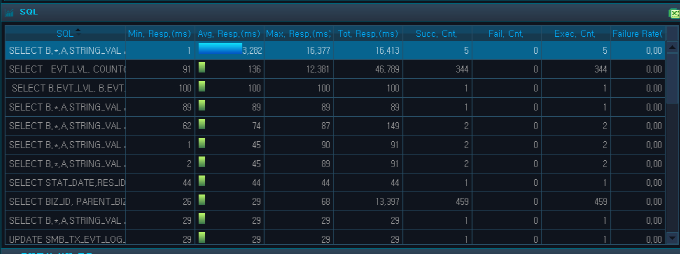
| Property | Description |
|---|---|
| SQL | Currently executing SQL. |
| Min. Resp.(ms) | Min service processing time. |
| Avg. Resp.(ms) | Average service response time. |
| Max. Resp.(ms) | Max service processing time. |
| Tot. Resp.(ms) | Total service processing time. |
| Succ. Cnt. | Number of successful executions of the SQL. |
| Fail. Cnt. | Number of failed executions of the SQL. |
| Exec. Cnt. | Number of service executions. |
| Failure Rate(%) | Failure rate of the requested service. |
Transaction Execution List Table
When a row is selected from the SQL Table, Trend Graph and Transaction Execution List is displayed.
The following is description of the Transaction Execution List Table properties. When a table row is selected, a popup window with drill-down Transaction Execution List is displayed.

| Property | Description |
|---|---|
| Service Name | Request name that identifies the service. (JSP URL, EJB Method, etc.) |
| Elapsed Time(ms) | Duration of service execution. |
| Start Time | Service start date and time. |
| End Time | Service termination date and time. |
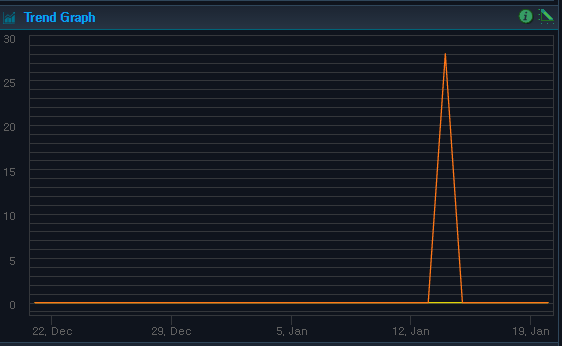
Trend Graph
Analyzes service trends of the selected containers in the Working List. X axis shows date and time of the search period, and the Y axis shows the number of successfully processed services.
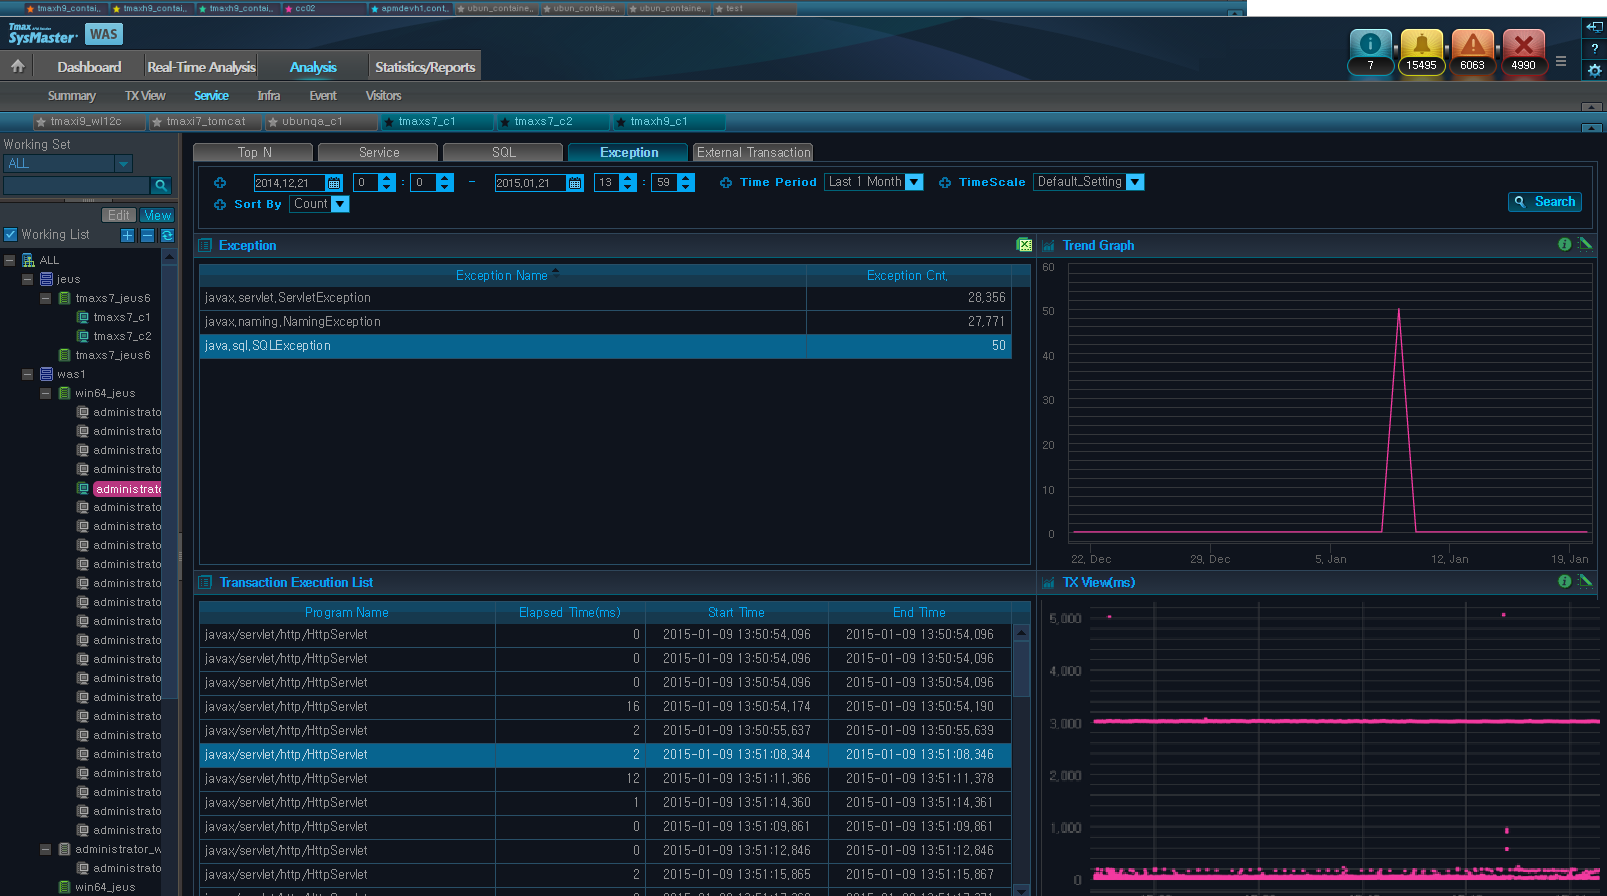
Exception displays exception data of one or more selected containers and Trend Graph for the related services. When a value is selected on the Trend Graph, Transaction Execution List and TX View(ms) for the selected time period is displayed.
-
Search Condition
Set the following search condition, and then click [Search].
Search Condition Description Search Period Manually enter the 'Dates,' or select a 'Time Period.' By default, 'Time Period' is set to "Last 10 Min." Other options include "Last 1 Hr," "Last 1 Week," and "Last 1 Month." Sort By Data is displayed in a table sorted in descending order of a sort item (Count).
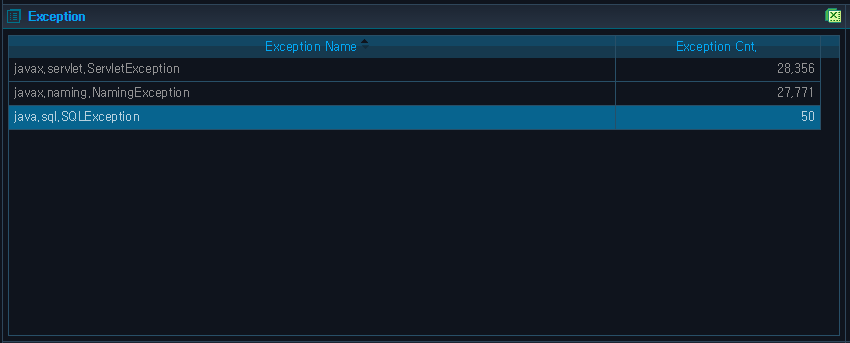
Exception Table
The following is description of the Exception Table properties.
| Property | Description |
|---|---|
| Exception Name | Exception name. |
| Exception Cnt. | Number of exception occurrences. |
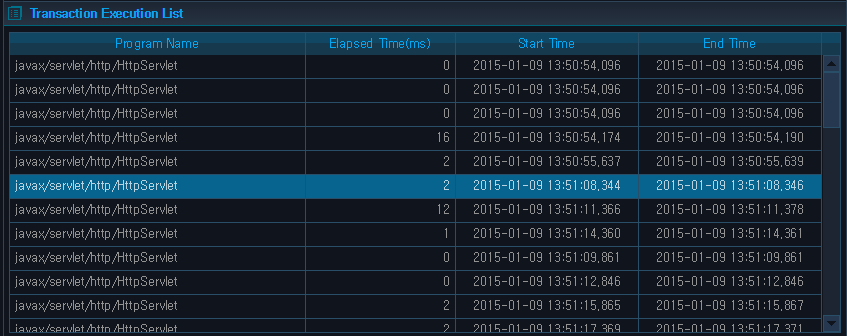
Transaction Execution List
When a row is selected from the Exception Table, related Trend Graph and Transaction Execution List are displayed.
The following is description of the Transaction Execution List Table properties. When a table row is selected, a popup window with drill-down Transaction Execution List is displayed.
| Property | Description |
|---|---|
| Program Name | Program name. (Name of a Servlet class, EJB class, etc.) |
| Elapsed Time(ms) | Duration of service execution. |
| Start Time | Service start date and time. |
| End Time | Service termination date and time. |
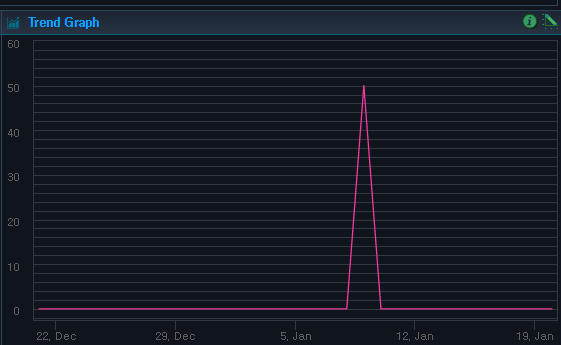
Trend Graph
Analyzes service trends of the selected containers in the Working List. X axis shows date and time of the search period, and the Y axis shows the number of successfully processed services.
External Transaction displays external transaction data of one or more selected containers and Trend Graph for the related services. When a value is selected from the Trend Graph, Transaction Execution List and TX View(ms) for the selected time period is displayed.
-
Search Condition
Set the following search condition, and then click [Search].
Search Condition Description Search Period Manually enter the 'Dates,' or select a 'Time Period'. By default, 'Time Period' is set to "Last 10 Min." Other options include "Last 1 Hr," "Last 1 Week," and "Last 1 Month." Sort By Data is displayed in a table sorted in descending order of a sort item (Avg Response Time, Success Cnt).
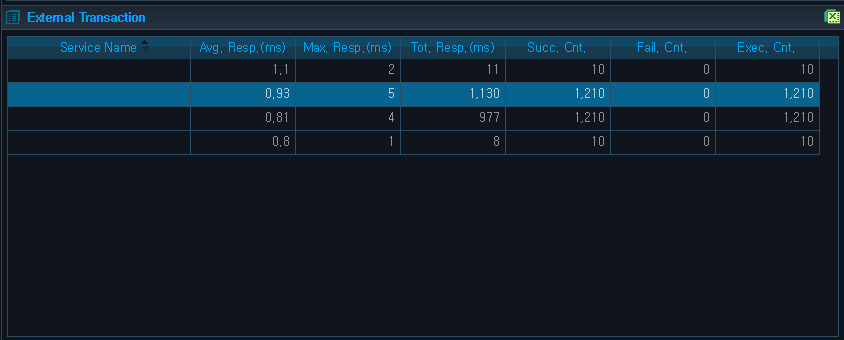
External Transaction Table
The following is description of the External Transaction Table properties.
| Property | Description |
|---|---|
| Service Name | Name of the service executed through an external transaction. |
| Avg. Resp.(ms) | Average response time of the service executed through an external transaction. |
| Max. Resp.(ms) | Max processing time of the service executed through an external transaction. |
| Tot. Resp.(ms) | Total processing time of the service executed through an external transaction. |
| Succ. Cnt. | Number of successful executions of the service executed through an external transaction. |
| Fail. Cnt. | Number of failed executions of the service executed through an external transaction. |
| Exec. Cnt. | Number of executions of the service executed through an external transaction. |
Transaction Execution List Table
When a row is selected from the External Transaction Table, related Trend Graph and Transaction Execution List are displayed.
The following is description of the Transaction Execution List Table properties. When a table row is selected, a popup window with drill-down Transaction Execution List is displayed.

| Property | Description |
|---|---|
| Service Name | Request name that identifies the service. (JSP URL, EJB Method, etc.) |
| Elapsed Time(ms) | Duration of service execution. |
| Start Time | Service start date and time. |
| End Time | Service termination date and time. |
Trend Graph
Analyzes service trends of the selected containers in the Working List. X axis shows date and time of the search period, and the Y axis shows the number of successfully processed services.
Infra displays data, related to resources and infra, detected at the time of the search.
Infra can be accessed from [WAS] > [Analysis] > [Infra] and consists of the following tabs.
-
[JVM]
-
[Java Pool]
-
[Unclaimed Resource]
-
[JNDI]
-
[Host]
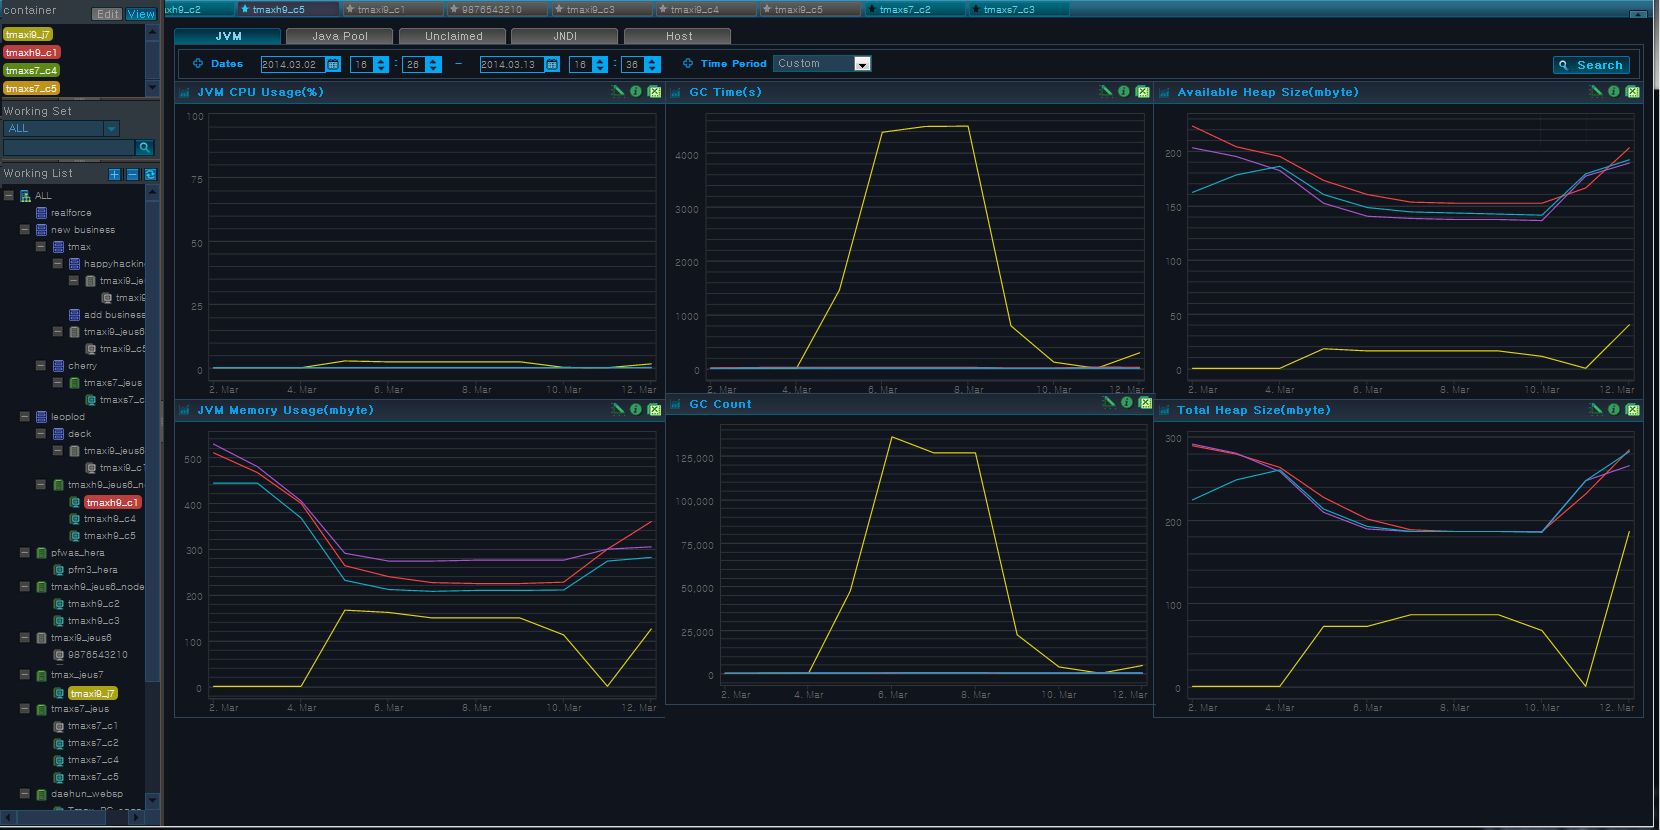
JVM displays JVM data, GC data, and heap data of one or more selected containers for the specified time period.
-
Search Condition
Set the following search condition, and then click [Search].
Search Condition Description Search Period Manually enter the 'Dates,' or select a 'Time Period'. By default, 'Time Period' is set to "Last 10 Min." Other options include "Last 1 Hr," "Last 1 Week," and "Last 1 Month." -
Chart
The following is description of the chart properties.
Chart Description JVM CPU Usage(%) JVM CPU usage of the selected container(s) in the Working List.
(X axis: Selected Time Period, Y axis: JVM CPU Usage(%))
JVM Memory Usage(mbyte) JVM memory usage of the selected container(s) in the Working List.
(X axis: Selected Time Period, Y axis: JVM Memory Usage (MB))
GC Time(s) Time spent in Garbage Collection by the selected container(s) in the Working List.
(X axis: Selected Time Period, Y axis: GC Time(s))
GC Count Number of times spent in Garbage Collection by the selected container(s) in the Working List.
(X axis: Selected Time Period, Y axis: GC Count)
Available Heap Size(mbyte) Available JVM heap memory size of the selected container(s) in the Working List.
(X axis: Selected Time Period, Y axis: Available Heap Size (MB))
Total Heap Size(mbyte) Total JVM heap memory size of the selected container(s) in the Working List.
(X axis: Selected Time Period, Y axis: Available Heap Size (MB))
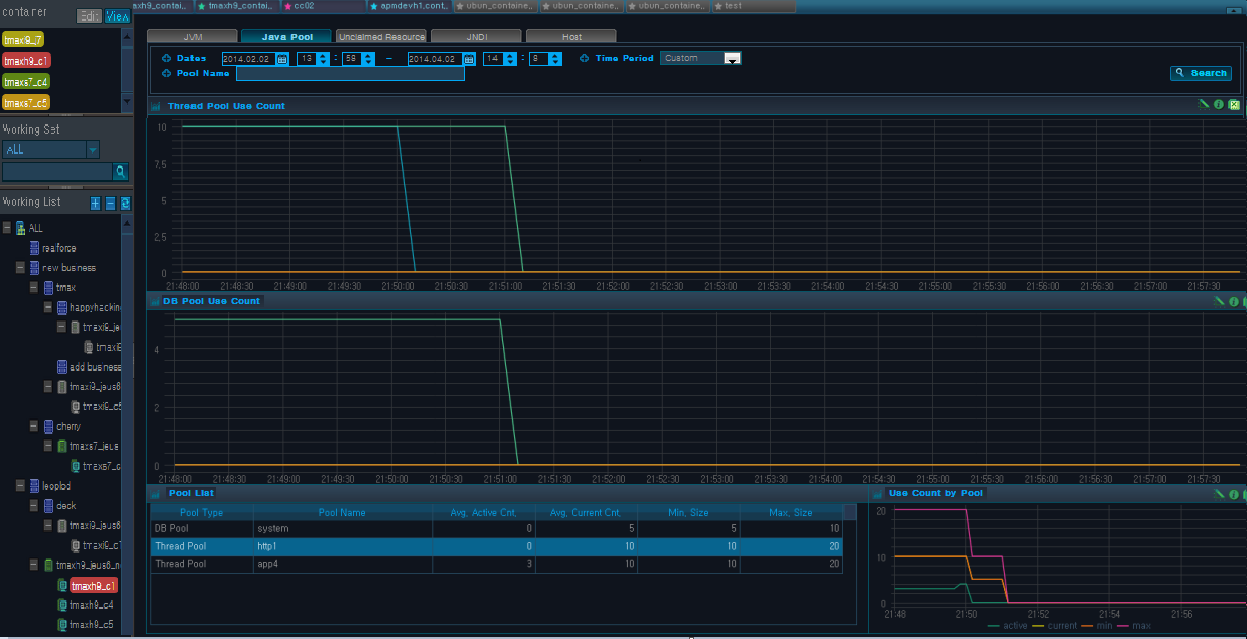
Java Pool displays information related to Java Pool data. Thread Pool and DB Pool data linked to WAS can be accessed from WAS status inquiry for Thread Pool and DB Pool in the units of a container.
-
Search Condition
Set the following search condition, and then click [Search].
Search Condition Description Search Period Manually enter the 'Dates,' or select a 'Time Period'. By default, 'Time Period' is set to "Last 10 Min." Other options include "Last 1 Hr," "Last 1 Week," and "Last 1 Month." Pool Name Pool name to search for. Finds all pool names with all or part of the search text. -
Chart
The following is description of the Java Pool chart properties.
Chart Description Thread Pool Use Count Number of times thread pool was used by the selected container(s) in the Working List.
(X axis: Selected Time Period, Y axis: Thread Pool Use Count)
DB Pool Use Count Number of times DB pool was used by the selected container(s) in the Working List.
(X axis: Selected Time Period, Y axis: DB Pool Use Count)
Use Count by Pool Number of times each pool was used by the selected container(s) in the Working List.
-
active cnt : active pool count
-
current cnt : avg active + avg Idle
-
min : min pool size
-
max : max pool size
(X axis: Selected Time Period, Y axis: Use Count by Pool)
-
-
Pool List
When a pool is selected from the Pool List, Use Count by Pool chart is displayed. The following is description of the Pool List properties.
Property Description Pool Type Pool type. (DB Pool or Thread Pool) Pool Name Pool name. Avg. Active Cnt. Average number of active threads. Avg. Current Cnt. Average number of current threads. (Avg. Active Cnt. + Avg. Idle Cnt.) Min. Size Min pool size. Max. Size Max pool size.
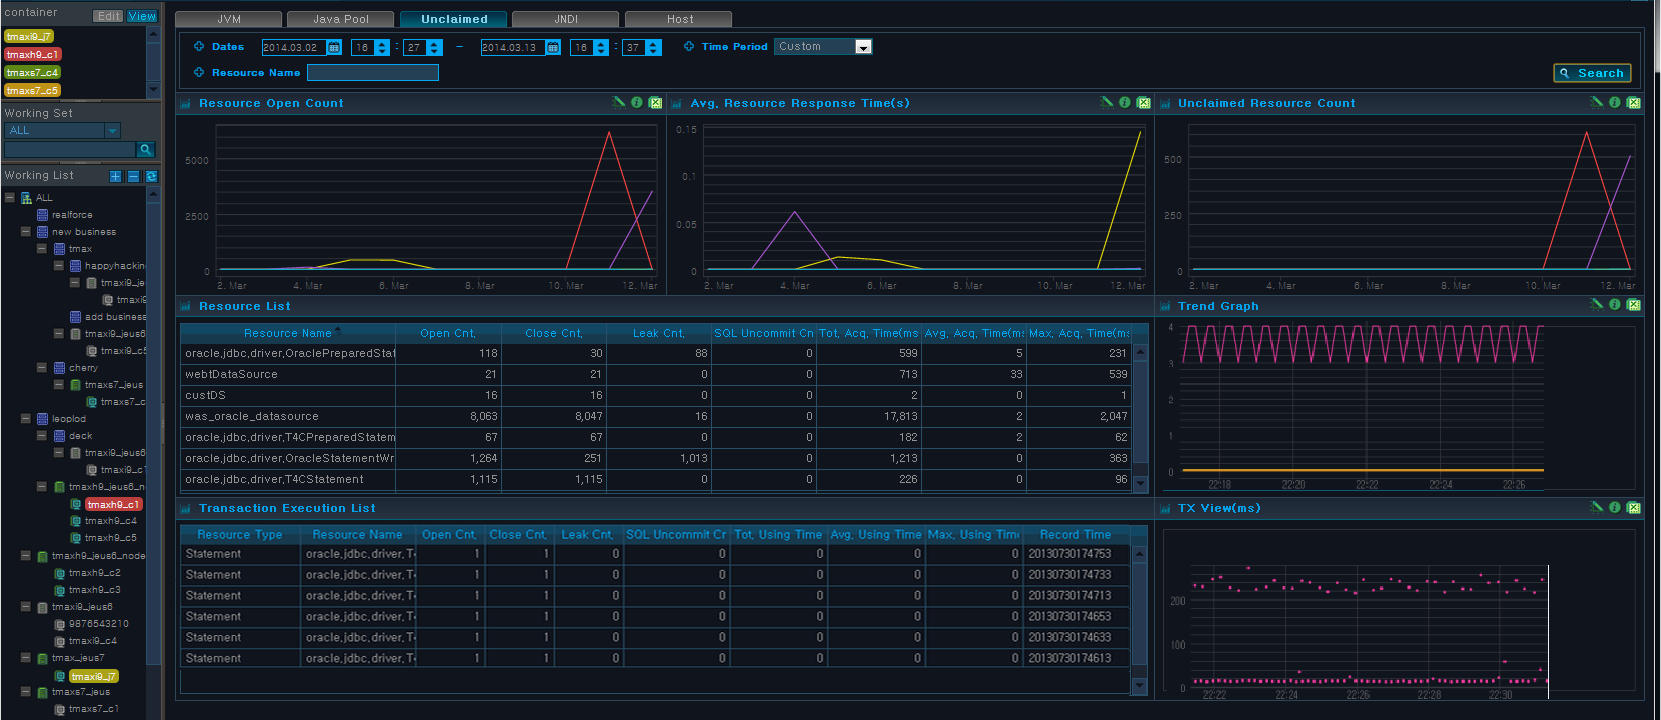
A resource refers to WAS system resource, including WAS-provided data source, file resource, etc., that is needed to execute a service. Resources are common property shared by applications in WAS, and they are important targets of management in terms of their acquisitions and returns. Resource list includes JDBC Connection (Pool), JDBC Connection (Data Source), JDBC Statement, TP Connection, etc.
Unclaimed Resource displays information related to unclaimed resources.
-
Search Condition
Set the following search condition, and then click [Search].
Search Condition Description Search Period Manually enter the 'Dates,' or select a 'Time Period'. By default, 'Time Period' is set to "Last 10 Min." Other options include "Last 1 Hr," "Last 1 Week," and "Last 1 Month." Resource Name Resource name to search for. Finds all resources with all or part of the search text. -
Chart
The following is description of the Unclaimed Resource chart properties.
Chart Description Resource Open Count Number of times a resource was opened for use by the selected container(s) in the Working List. Uses Open Cnt value of the resource.
(X axis: Selected Time Period, Y axis: Resource Open Count)
Avg. Resource Response Time(s) Avg. resource response time for the selected container(s) in the Working List.
(X axis: Selected Time Period, Y axis: Resource Avg. Response Time(s))
Unclaimed Resource Count Number of unclaimed resources for the selected container(s) in the Working List.
Resource Leak Cnt is calculated by taking the difference between Open Cnt and Close Cnt. Leak Cnt is used as the unclaimed resource count.
(X axis: Selected Time Period, Y axis: Unclaimed Resource Count)
Trend Graph When a row is selected from the Resource List, Trend Graph of Unclaimed Resource Count for the selected container(s) in the Working List is displayed.
Performs trend analysis of Unclaimed Resource Count by container.
(X axis: Selected Time Period, Y axis: Unclaimed Resource Count)
TX View When a value is selected from the Trend Graph, TX View(ms) for the selected time is displayed.
(X axis: Time selected from Trend Graph, Y axis: Elapsed Time(ms))
-
Resource List
The following is description of the Resource List properties.
Property Description Resource Name Resource name. Open Cnt. Number of times resource was opened for use. (e.g.: JDBC Connection Open) Close Cnt. Number of times resource was returned. Leak Cnt. Leak count. (Open Cnt. - Close Cnt.) SQL Uncommit Cnt. Number of SQLs that have not been committed. Tot. Using Time(ms) Total time for securing the resource. Avg. Using Time(ms) Average time for securing the resource. Max. Using Time(ms) Max time for securing the resource. -
Transaction Execution List
The following is description of the Transaction Execution List properties.
Property Description Resource Type Resource type (WAS, System). Resource Name Resource name. Open Cnt. Number of times resource was opened for use. (e.g.: JDBC Connection Open) Close Cnt. Number of times resource was returned. Leak Cnt. Leak count. (Open Cnt. - Close Cnt.) SQL Uncommit Cnt. Number of SQLs that have not been committed. Tot. Using Time(ms) Total resource using time. Avg. Using Time(ms) Average resource using time. Max. Using Time(ms) Max resource using time. Record Time Time when resource acquisition is completed.
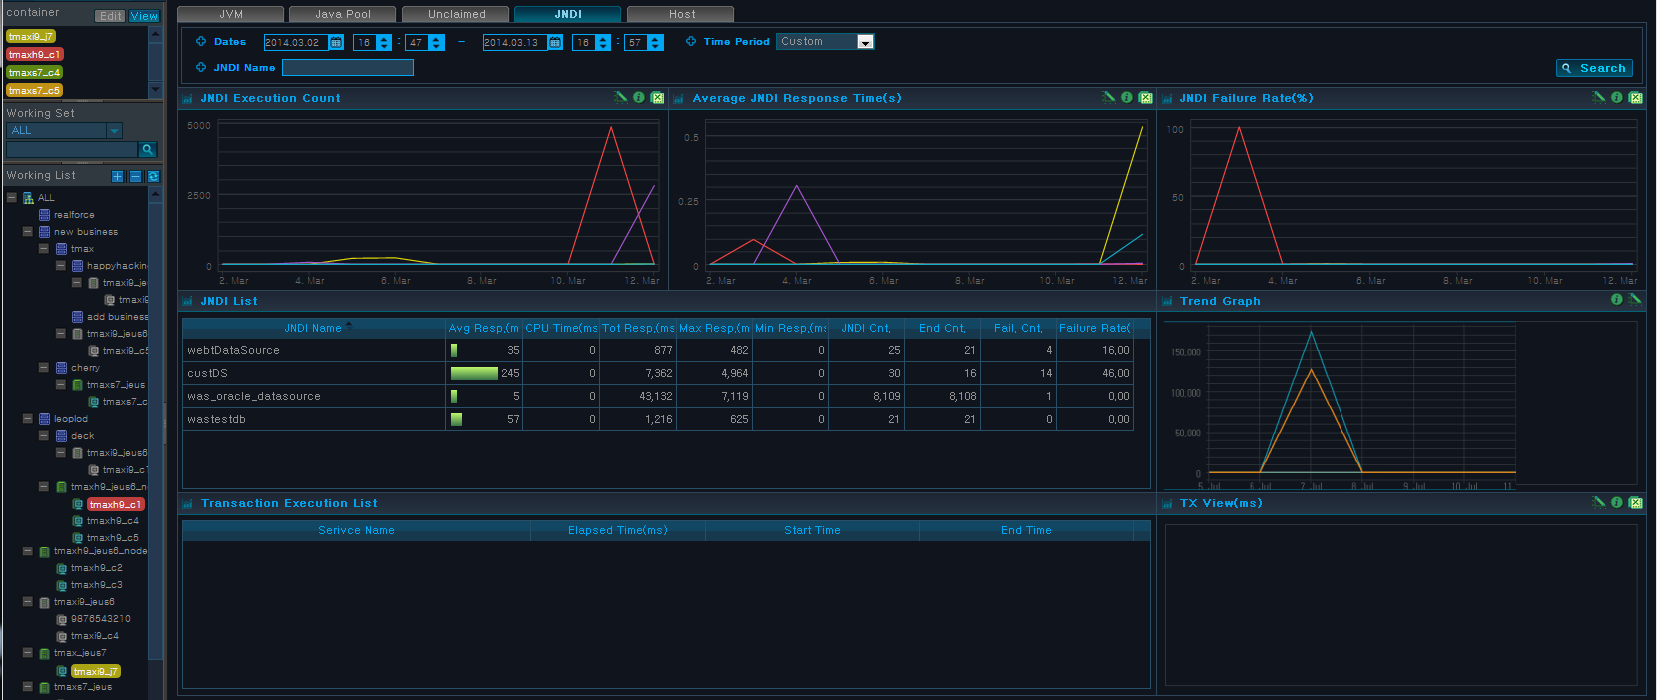
JNDI displays JNDI data for the selected containers.
-
Search Condition
Set the following search condition, and then click [Search].
Search Condition Description Search Period Manually enter the 'Dates,' or select a 'Time Period'. By default, 'Time Period' is set to "Last 10 Min." Other options include "Last 1 Hr," "Last 1 Week," and "Last 1 Month." JNDI Name JNDI name to search for. Finds all JNDI names with all or part of the search text. -
Chart
The following is description of the chart properties.
Chart Description JNDI Execution Count Number of resources opened for use by the selected container(s) in the Working List.
Uses resource's Open Cnt value.
(X axis: Selected Time Period, Y axis: Resource Open Count)
Average JNDI Response Time(s) Resource average response time for the selected container(s) in the Working List.
(X axis: Selected Time Period, Y axis: JNDI Avg. Response Time(s))
JNDI Failure Rate(%) Number of unclaimed resources for the selected container(s) in the Working List.
Resource Leak Cnt is calculated by taking the difference between Open Cnt and Close Cnt. Leak Cnt is used as the unclaimed resource count.
(X axis: Selected Time Period, Y axis: Unclaimed Resource Count)
Trend Graph When a row is selected from the Resource List, Trend Graph of Unclaimed Resource Count for the selected container(s) in the Working List is displayed
Performs trend analysis of Unclaimed Resource Count by container.
(X axis: Selected Time Period, Y axis: Unclaimed Resource Count)
TX View When a value is selected from the Trend Graph, TX View(ms) for the selected time is displayed.
(X axis: Time selected from Trend Graph, Y axis: Elapsed Time(ms))
-
JNDI List
The following is description of the JNDI List properties.
Property Description JNDI Name JNDI name. Avg Resp.(ms) JNDI average response time. CPU Time(ms) Average CPU time used by JNDI. Tot Resp.(ms) Total response time for invoking JNDI. Max Resp.(ms) Max response time for invoking JNDI. Min Resp.(ms) Min response time for invoking JNDI. JNDI Cnt. Number of JNDI requests. End Cnt. Number of completed JNDI requests. Fail. Cnt. Number of failed JNDI requests. Failure Rate(%) Percent of failed JNDI requests. -
Trend Graph
When a JNDI row is selected from the JNDI List Table, related Trend Graph is displayed. Select a value on the Trend Graph to view the TX View(ms) Chart for the selected value.
-
Transaction Execution List
The following is description of the Transaction Execution List properties.
Property Description Service Name Request name that identifies the service. (JSP URL, EJB Method, etc.) Elapsed Time(ms) Duration of service execution. Start Time Service start date and time. End Time Service termination date and time.
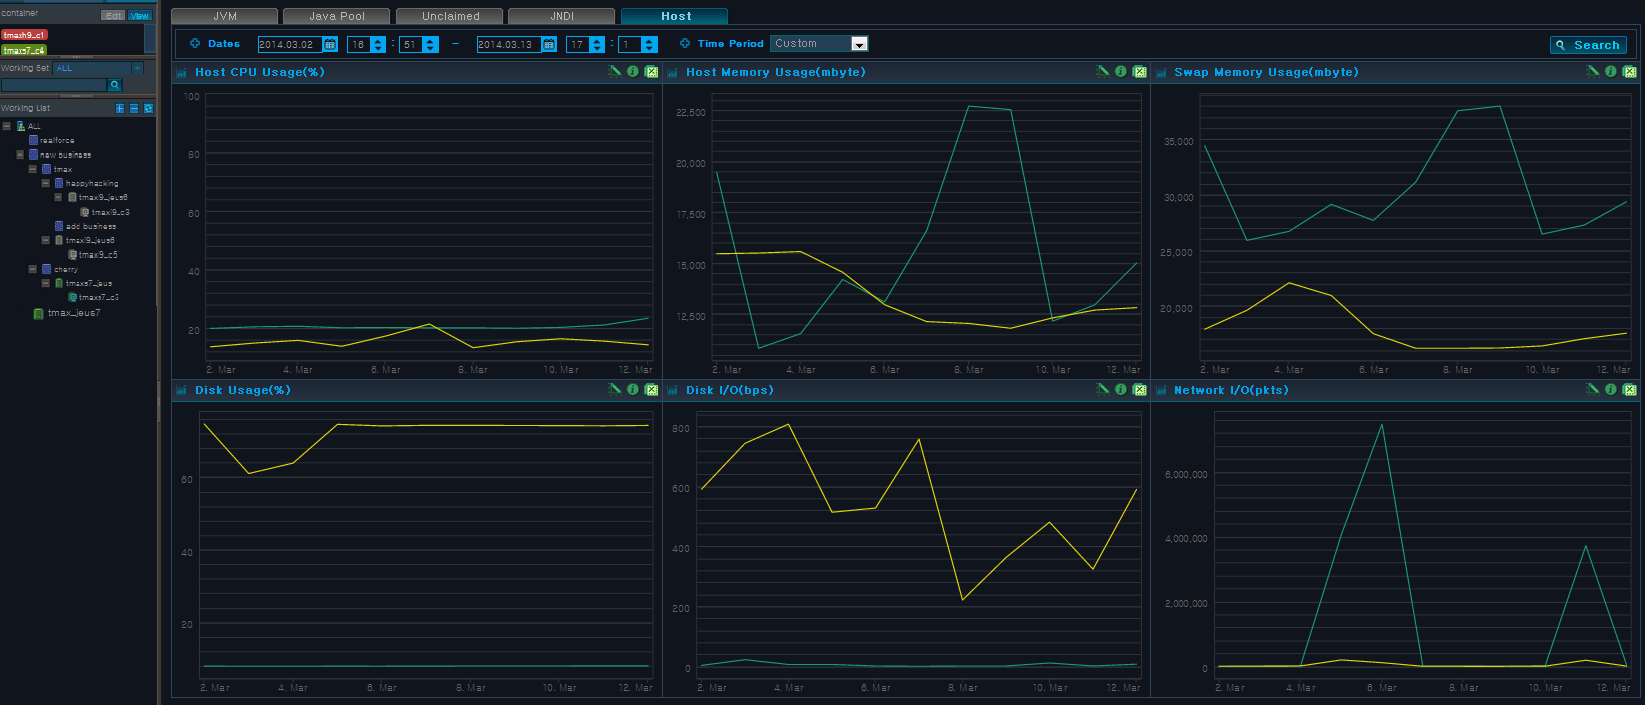
Data for the system where WAS is installed can be accessed from [User-defined System Dashboard]. Host displays data of the host system of the containers or nodes selected in WAS component tree.
Host status data is collected in units of a container, and are displayed as a graph or container unit. For detailed information, refer to "2.6. User-defined System Dashboard".
-
Search Condition
Set the following search condition, and then click [Search].
Search Condition Description Search Period Manually enter the 'Dates,' or select a 'Time Period'. By default, 'Time Period' is set to "Last 10 Min." Other options include "Last 1 Hr," "Last 1 Week," and "Last 1 Month."
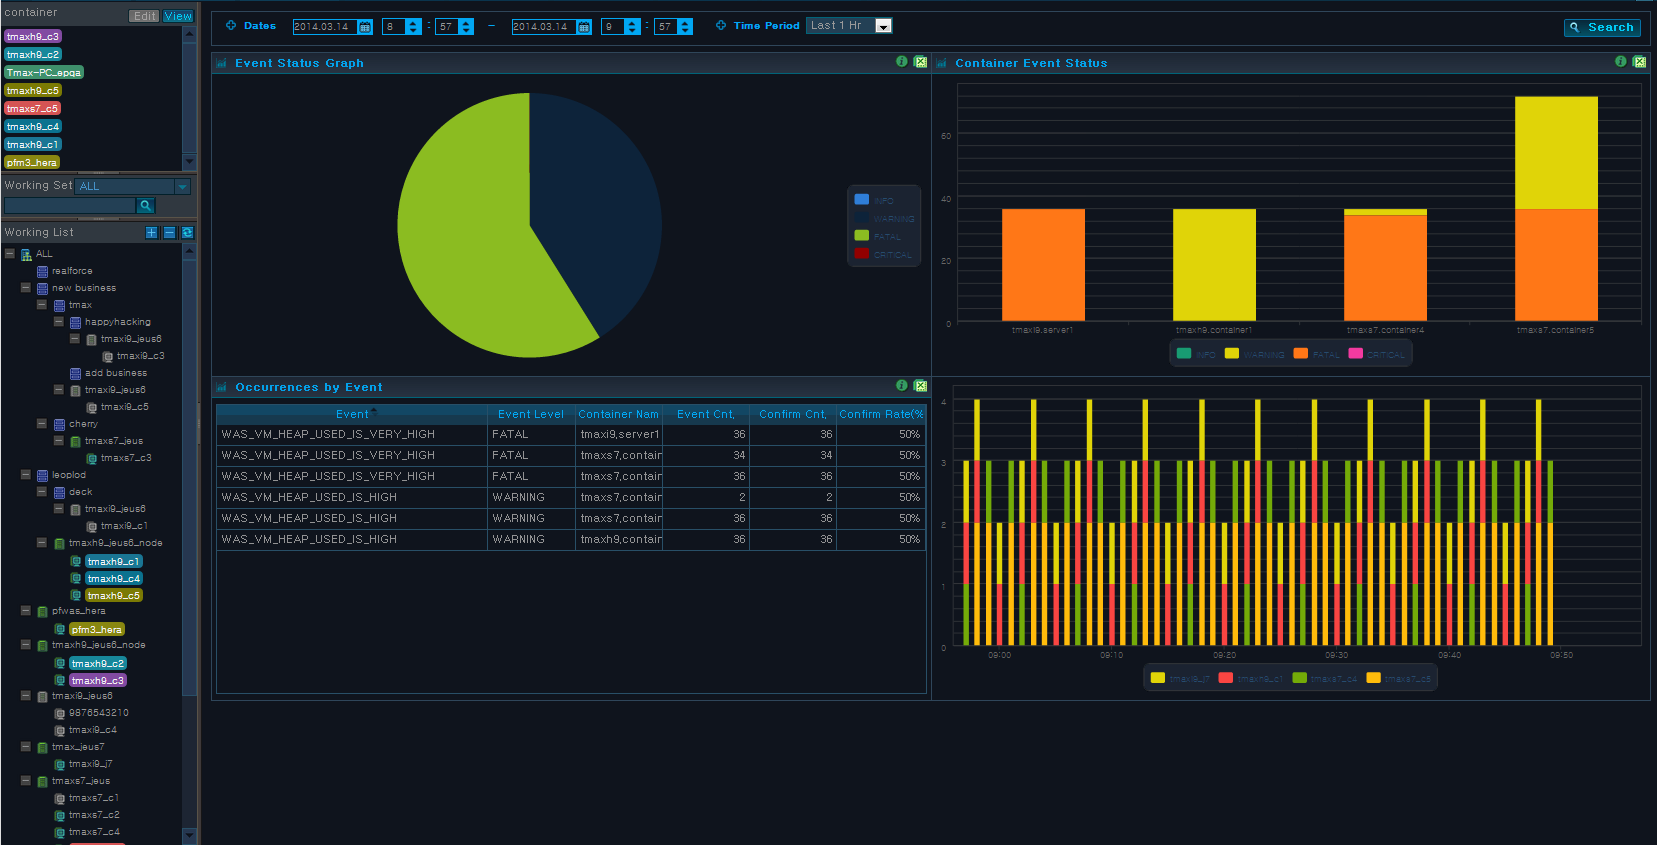
Event displays Event Status Graph, Container Event Status, and Occurrences by Event table for each selected containers.
Event can be accessed from [WAS] > [Analysis] > [Event].
-
Search Condition
Set the following search condition, and then click [Search].
Search Condition Description Search Period Manually enter the 'Dates,' or select a 'Time Period'. By default, 'Time Period' is set to "Last 10 Min." Other options include "Last 1 Hr," "Last 1 Week," and "Last 1 Month."
-
Chart
The following is description of the chart properties.
Chart Description Event Status Graph Cumulative event status graph for the selected container(s) in the Working List.
Event Occurrences for each container are collected for each event level (INFO, WARNING, BAD, CRITICAL) and are displayed using a pie chart.
Container Event Status -
Top chart is a vertical stacked bar chart for the selected container(s) in the Working List. Event Occurrences for each container are collected for each event level (INFO, WARNING, BAD, CRITICAL).
(X axis: Container Name, Y axis: Cumulative Event Occurrence Count)
-
Bottom chart is vertical stacked bar chart using the event occurrence count of the selected container(s) in the Working List
(X : Selected Time Period, Y : Event Occurrence Count)
-
-
Occurrences by Event List
The following is description of the properties.
Property Description Event Event name. Event Level Event level. (INFO, WARNING, BAD, CRITICAL) Event Cnt. Event occurrence count. Confirm Cnt. Event confirmation count. Confirm Rate(%) Event confirmation rate.
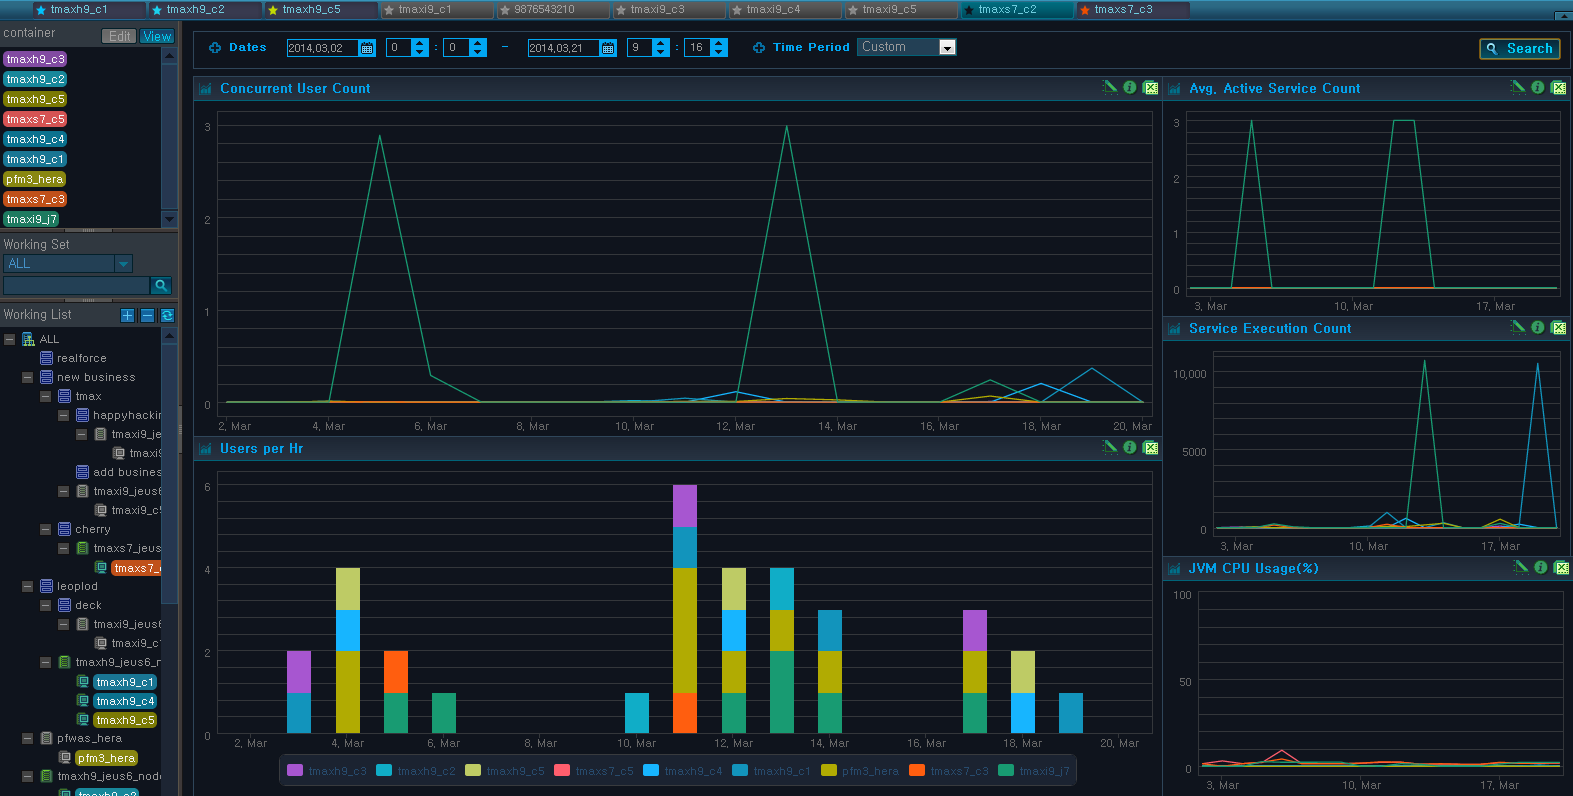
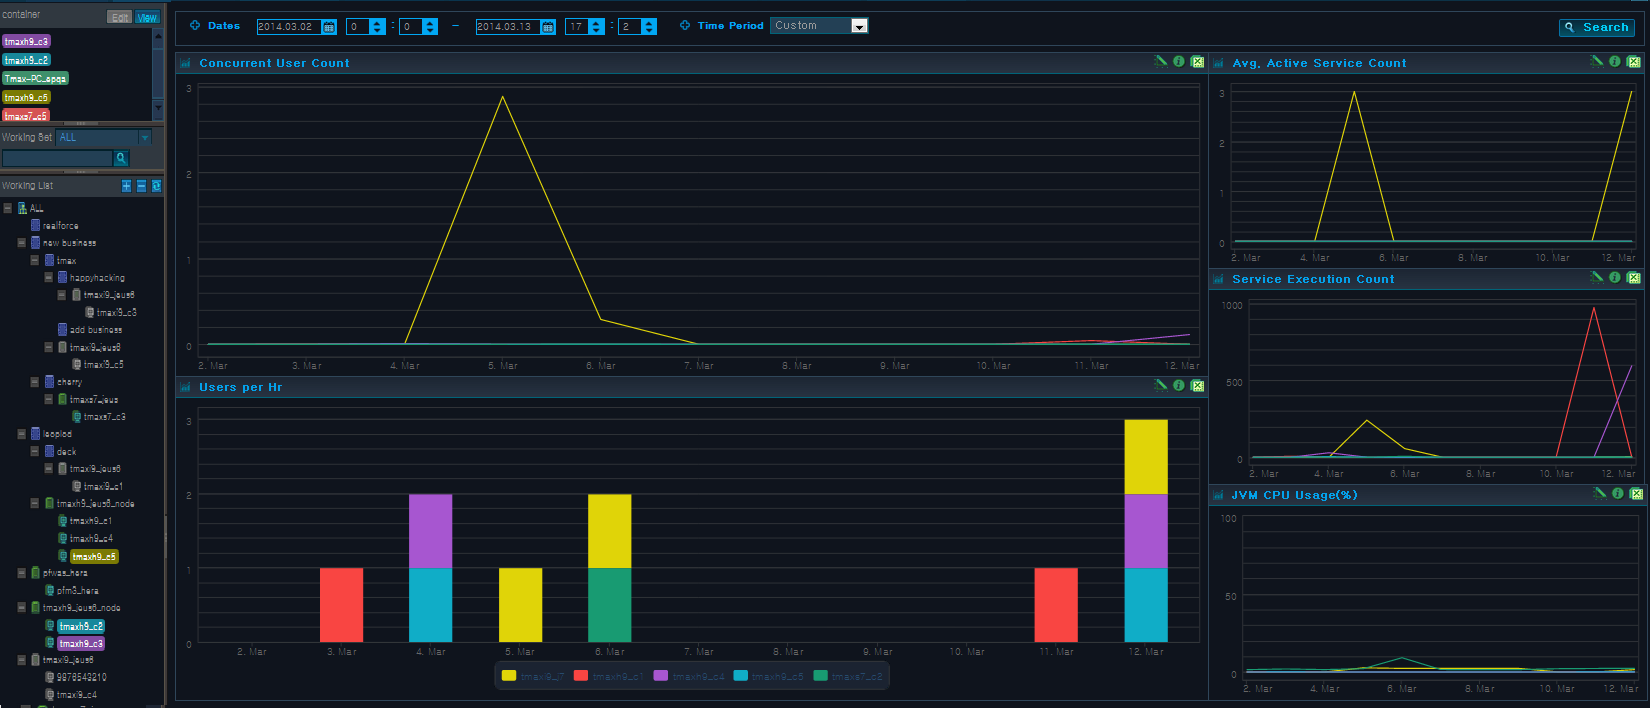
Visitor displays the number of concurrent users, average active services, service executions, and hourly users by container.
Visitor can be accessed from [WAS] > [Analysis] > [Visitor].
-
Search Condition
Set the following search condition, and then click [Search].
Search Condition Description Search Period Manually enter the 'Dates,' or select a 'Time Period'. By default, 'Time Period' is set to "Last 10 Min." Other options include "Last 1 Hr," "Last 1 Week," and "Last 1 Month." -
Chart
The following is description of the chart properties.
Chart Description Concurrent User Count Number of concurrent users for the selected container(s) in the Working List.
Data is collected using the following equation.
ConcurrentUser = Throughput(tps) * {Resp.Time(sec) + ThinkTime(sec)}(X axis: Selected Time Period, Y axis: Number of Concurrent Users)
Users per Hr Number of users per hour for the selected container(s) in the Working List.
Collects hourly user count per container and displays the data using a vertical stacked bar chart. (X axis: Selected Time Period, Y axis: Hourly User Count)
Avg. Active Service Count Average number of active services for the selected container(s) in the Working List.
(X axis: Selected Time Period, Y axis: Avg. Active Service Count)
Service Execution Count Number of service executions for the selected container(s) in the Working List.
(X axis: Selected Time Period, Y axis: Service Execution Count)
JVM CPU Usage(%) JVM CPU usage for the selected container(s) in the Working List.
(X axis: Selected Time Period, Y axis: JVM CPU Usage(%))
In Custom Report, a user can select the desired report and create a menu for it.
Select a widget from [ADMIN] > [Custom Dashboard] > [Report], and adjust its size and location. After arranging the report, save the report to register it in the [Report] menu. For detailed information, refer to "SysMaster Administrator's Guide".
Custom Report can be accessed from [WAS] > [Analysis] > [Custom Report].
The following is an example of a custom report.