JTC Monitoring (JEUS6)
This chapter describes how to monitor JTC using the JEUS console tool and WebAdmin.
1. Overview
While JTC operates, it is required to manage JTC by checking the JTC local domain and remote domain configurations and the numbers of calls and responses through a domain. For this, the JTC module provides JTC information through the JEUS console tool and WebAdmin.
|
JEUS 6 fix#7 and later supports JTC management through the JEUS console tool and WebAdmin. |
2. Configuration
To manage JTC, relevant configurations are required.
To use the JEUS console tool to use JTC Admin, locate the jext_webtadmin.jar file deployed in the lib/system directory under the JEUS installation directory.
Besides applying the deployed module, execute the following.
-
Monitoring-related configuration (directory and mbean settings)
-
Configure webadmin.application
-
Configure node.xml
-
Configure catalog_ko.xml
-
Configure jeus.css
|
For more information about how to configure each file and setting, refer to Configuration in Tmax WebT User Guide. |
3. JTC Monitoring
This section describes how to monitor JTC using the JEUS console tool and WebAmin.
3.1. Using the JEUS Console Tool
JEUS provides the jeusadmin command, which checks the container status. This newly added command shows the most detailed information.
To use the management tool, execute the following in a console. After executing the command, the user is moved to the jeusadmin command prompt screen.
jeusadmin <container name> -U <user name> -P <user passwd>
The following shows how to check the JTC status.
jtcadmin [-d domainName] [-l]
The execution results, which depend on the options inputted, are as follows. Configuration items and their values in the result are identical to the items and values set in webt.properties.
-
Execution without an option
Displays all configured JTC information.
-
[-d domainName]
Displays information about the specified remote domain.
container name : Joonsoo-PC_container2
domain info --

domainName :          TMXDOM
interval :            30
timeout :             -1
tx timeout :          -1
read timeout :        -1
thread min :          1
thread max :          1
ip :                  192.168.33.84
port :                9111
notx :                false
backup :              null
service list :
request :             0
reply :               0
prepare :             0
commit :              0
rollback :            0
-
[-l]
Displays local domain information, the number of local service calls, and logging information.
container name : Joonsoo-PC_container2
Local Info --
log directory :       null
log file :            null
prepare count :       0
commit count :        0
rollback count :      1
remote domain list :  TMXDOM
ejb call list :
----------------------------------------
service name        call count
----------------------------------------
GSVC01              1

cluster domain list : TDOM1:TMXDOM,TMXDOM2
3.2. Using JEUS WebAdmin
JEUS provides WebAdmin, a web browser based management tool, to check the container status. To access WebAdmin, start JEUS and then enter the following address in a web browser.
http://<ip address>:9744/webadmin
The following screen is displayed after logging in. The WebT, JTmax, and JTC monitoring menus are found in [JEUS Monitoring] under the JEUS Node Tree of the left navigation window.
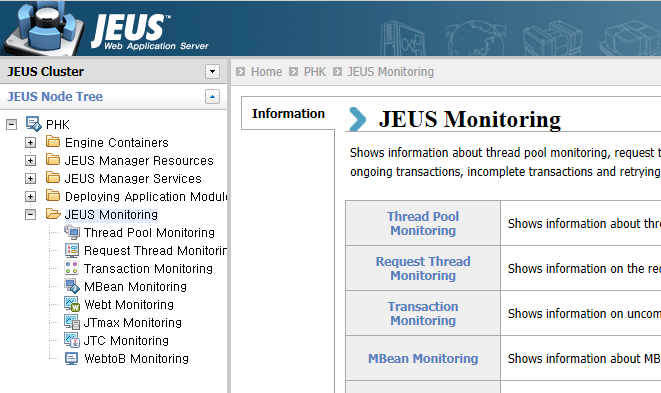
|
In JEUS WebAdmin, select [JEUS Monitoring] > [JTC Monitoring] under the JEUS Node Tree to display the following JTC Monitoring screen.
The JTC Monitoring screen displays information about monitoring, logging, and connection groups. The items displayed and their values are identical to the items and values set in webt.properties.
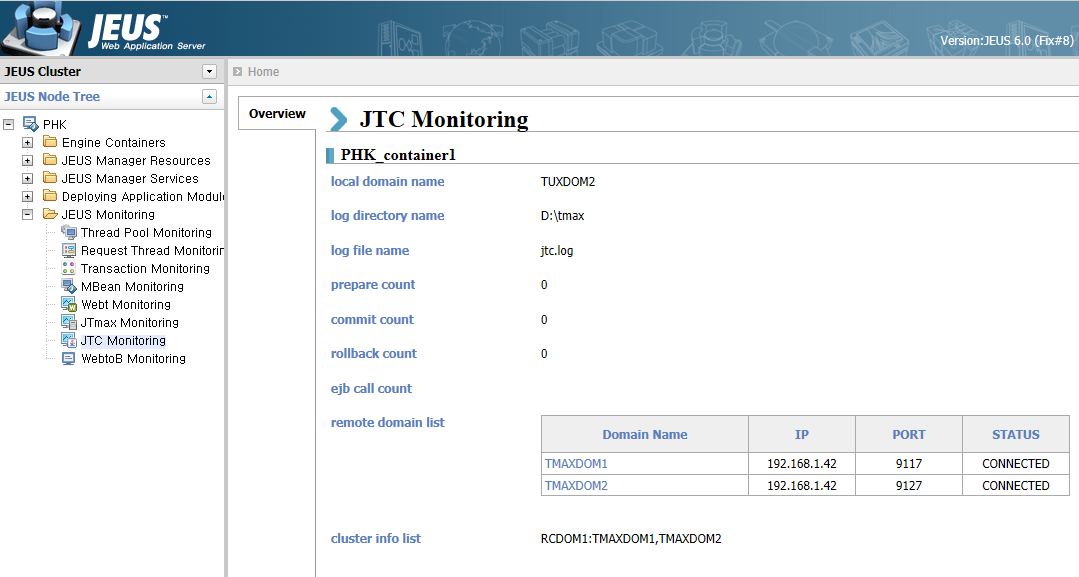
The following describes each item displayed in the screen.
| Item | Description |
|---|---|
local domain name |
Configured local domain. |
log directory name |
Directory in which log files are stored. |
log file name |
Log file name. |
prepare count |
Number of xa_prepare operations handled. |
commit count |
Number of xa_commit operations handled. |
rollback count |
Number of xa_rollback operations handled. |
ejb call count |
Number of configured EJB calls. |
remote domain list |
List of remote domains. See the table below for information about each item displayed. |
cluster info list |
List of domains clustered. |
The following describes each item displayed in the 'remote domain list':
| Item | Description |
|---|---|
Domain Name |
Remote domain name. |
IP |
IP address of the remote domain. |
PORT |
Port of the remote domain. |
STATUS |
Current status of the remote domain.
|
In the JTC Monitoring screen, click a domain name in the 'remote domain list' to display details such as configuration and operational information.
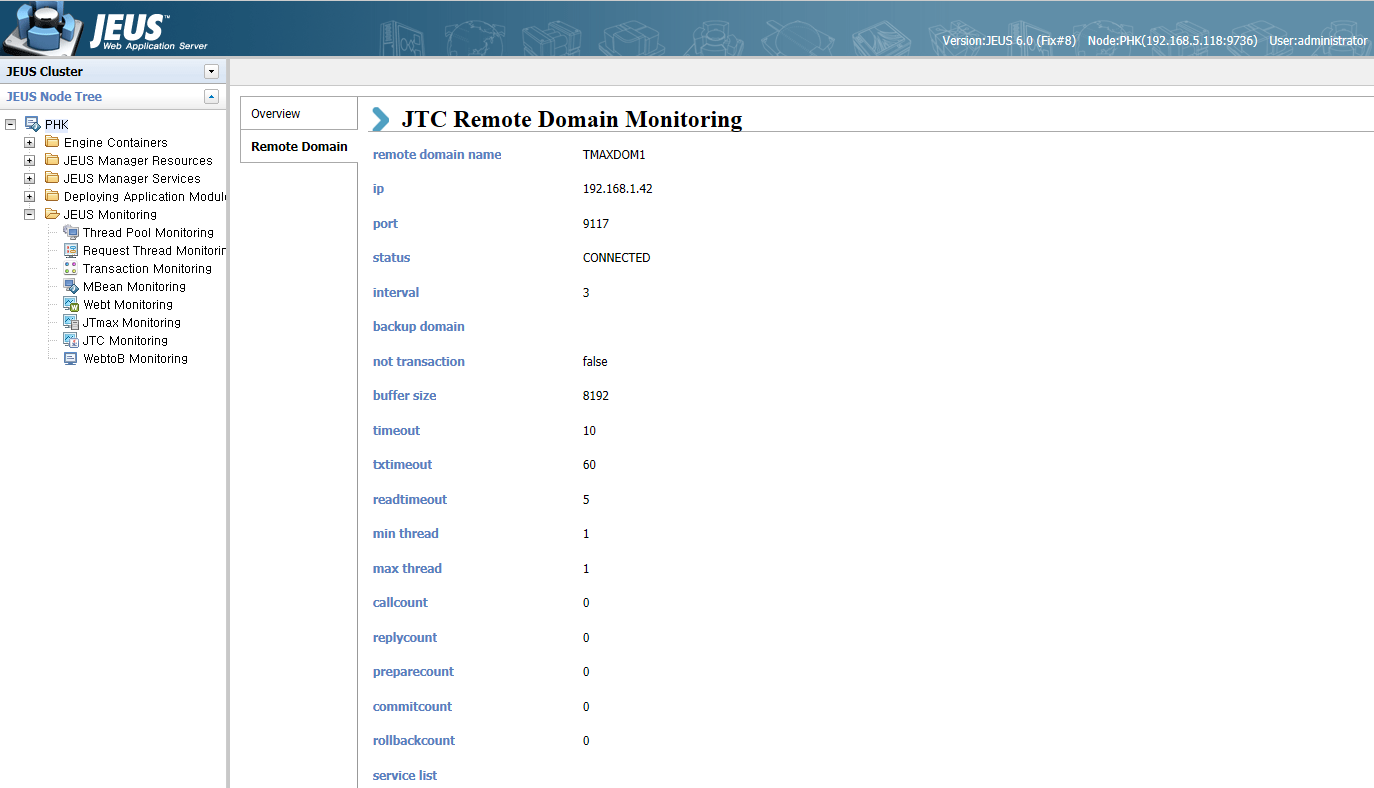
Each item displays configured information. The fields 'callcount', 'replycount', 'preparecount', 'commitcount', and 'rollbackcount' each indicate the total number of calls, replies, prepares, commits, and rollbacks handled.