Monitoring (JEUS 6)
This chapter describes how to configure an environment to monitor WebT and JTmax, using the JEUS console tool and WebAdmin.
1. Overview
When WebT is running, you may need to view the current environment configuration of WebT connection groups, or check the connection group status, connection requests, and response counts. When JTmax is running, it is also necessary to check the environment configuration, the number of running threads, and method call statistics. For these purposes, the WebT module provides WebT and JTmax operational information through the JEUS console tool and WebAdmin.
|
The WebT administration features provided through JEUS WebAdmin and console tools are supported starting from JEUS 6 Fix#7 onwards. |
2. Environment Configuration
To use WebT administrative features, you must perform several tasks, including applying certain separately provided modules.
First of all, to use WebT Admin and JTmax Admin through the JEUS administration tools (console and WebAdmin), you need to place the jext_webtadmin.jar file, which is separately deployed, in the lib/system directory under the JEUS installation directory.
The other necessary tasks are as follows:
-
Monitoring configuration (directories and mbeans setting)
-
webadmin.application configuration
-
node.xml configuration
-
catalog_ko.xml configuration
-
jeus.css configuration
Monitoring Configuration
To use the WebT and JTmax monitoring menus in JEUS WebAdmin, move the separately provided jeus directory to the following location under the JEUS installation directory, overwriting any existing files.
webhome/admin_home/WEB-INF/classes
To enable monitoring features, mbean settings are required in the configuration files as follows:
-
WebT configuration
webt.properties
webt.mbean=true
-
JTmax configuration
<JEUSMain.xml>
<external-resource> <property> <key>mbean</key> <value>true</value> </property> </external-resource> -
JTC configuration
tux.properties
tux.mbean=true
webadmin.application
Edit the webadmin.application file which is located in the following path under the JEUS installation directory. The file is .xml.
webhome/admin_home/WEB-INF
Add the following in the <page> node under the <application> node.
-
WebT configuration
<!--WEBT PAGE settings-->
<page name="JeusMonitoringWebtMonitoringService_Overview"
specification-path="/jeus/tool/webadmin/page/JeusMonitoringWebtMonitoringService/Overview.page"/>
<page name="JeusMonitoringWebtMonitoringService_Group"
specification-path="/jeus/tool/webadmin/page/JeusMonitoringWebtMonitoringService/Group.page"/>
-
JTmax configuration
<!--JTMAX PAGE settings-->
<page name="JeusMonitoringJTmaxMonitoringService_Overview"
specification-path="/jeus/tool/webadmin/page/JeusMonitoringJTmaxMonitoringService/Overview.page"/>
-
JTC configuration
<!--JTC PAGE settings-->
<page name="JeusMonitoringJTCMonitoringService_Overview"
specification-path="/jeus/tool/webadmin/page/JeusMonitoringJTCMonitoringService/Overview.page"/>
<page name="JeusMonitoringJTCMonitoringService_Remote"
specification-path="/jeus/tool/webadmin/page/JeusMonitoringJTCMonitoringService/Remote.page"/>
node.xml
Edit the node.xml file in the following path under the directory where JEUS is installed:
webhome/admin_home/WEB-INF/classes/jeus/tool/webadmin/resource
Add the following in the <node> node under the <node-specification> node in the node.xml file.
-
WebT configuration
<!--WEBT settings--> <node j2ee-type="WebtConnectionGroup" key="NodeTree.JeusMonitoring.WebtMonitoringService" page="JeusMonitoringWebtMonitoringService_Overview" target="rightPane" static="true"> <parent j2ee-type="Folder" jeus-type="JeusMonitoring"/> <delegator j2ee-type="JeusService" jeus-type="JeusManager"/> <icon state="running" icon="webt_monitor"/> <icon state="xml" icon="webt_monitor"/> <icon state="failed" icon="webt_monitor"/> </node> -
JTmax configuration
<!--JTMAX settings--> <node j2ee-type="JTmaxConnectionGroup" key="NodeTree.JeusMonitoring.JTmaxMonitoringService" page="JeusMonitoringJTmaxMonitoringService_Overview" target="rightPane" static="true"> <parent j2ee-type="Folder" jeus-type="JeusMonitoring"/> <delegator j2ee-type="JeusService" jeus-type="JeusManager"/> <icon state="running" icon="jtmax_monitor"/> <icon state="xml" icon="jtmax_monitor"/> <icon state="failed" icon="jtmax_monitor"/> </node> -
JTC configuration
<!--JTC settings-->
<node j2ee-type="JTCConnectionGroup"
        key="NodeTree.JeusMonitoring.JTCMonitoringService"
        page="JeusMonitoringJTCMonitoringService_Overview" target="rightPane"
        static="true">
    <parent j2ee-type="Folder" jeus-type="JeusMonitoring"/>
    <delegator j2ee-type="JeusService" jeus-type="JeusManager"/>

    <icon state="running" icon="jtc_monitor"/>
    <icon state="xml" icon="jtc_monitor"/>
    <icon state="failed" icon="jtc_monitor"/>
</node>
catalog_ko.xml
Edit the catalog_ko.xml file which is located in the following path under the directory where JEUS is installed.
webhome/admin_home/WEB-INF/classes/jeus/tool/webadmiin/resource/catalog
Add the following in the <text> node under the <catalog> node.
-
WebT configuration
<!--WEBT settings-->
<text key="NodeTree.JeusMonitoring.WebtMonitoringService">WebT Monitoring</text>
<text key="JeusMonitoringWebtMonitoringService_Overview">Overview</text>
<text key="JeusMonitoringWebtMonitoringService_Group">Shared Connection Group</text>
<text key="webt.overview.title">Webt Monitoring</text>
<text key="webt.group.title">Webt Shared Connection Group Monitoring</text>
-
JTmax configuration
<!--JTMAX settings-->
<text key="jtmax.overview.title">JTmax Monitoring</text>
<text key="NodeTree.JeusMonitoring.JTmaxMonitoringService">JTmax Monitoring</text>
<text key="JeusMonitoringJTmaxMonitoringService_Overview">Overview</text>
-
JTC configuration
<!--JTC settings-->
<text key="NodeTree.JeusMonitoring.JTCMonitoringService">JTC Monitoring</text>
<text key="JeusMonitoringJTCMonitoringService_Overview">Overview</text>
<text key="JeusMonitoringJTCMonitoringService_Remote">Remote Domain</text>
<text key="jtc.overview.title">JTC Monitoring</text>
<text key="jtc.remote.title">JTC Remote Domain Monitoring</text>
jeus.css
Edit the jeus.css file which is located in the following path under the directory where JEUS is installed.
webhome/admin_home/css
Add the following to the end of the file.
.jtc_monitor{background: url("../image/mbean/jtc.gif") no-repeat
scroll;}.webt_monitor{background: url("../image/mbean/webt.gif") no-repeat
scroll;}.jtmax_monitor{background: url("../image/mbean/jt
max.gif") no-repeat scroll;}
3. WebT Monitoring
This section describes how to monitor WebT using the JEUS console tool and WebAdmin.
3.1. Using JEUS Console Tool
JEUS provides a new command, jeusadmin, which checks the status of containers. This command displays detailed information about each container.
Entering the following command in the console launches the jeusadmin prompt.
jeusadmin container name -U user name -P user passwd
jeusadmin provides the following commands to support monitoring of WebT.
-
webtadmin
-
webtinfo
-
webtinfo2
-
webtdetailinfo
-
webtshrink
-
webtreconfig
webtadmin
The webtadmin command displays the WebT status information. Environment settings and their values printed by webtadmin match those configured by the user in the JEUSMain.xml or webt.properties file.
-
Usage
webtadmin [-C containerName] [-c connectionName] [-m] [-g groupName]
-
Example
Description of each option and execution results are as follows: ** When executing without options
+ If you run the command without using any options, all WebT information configured will be displayed.
-
[-C containerName]
Displays the specified container information.
container name : <container Name>
-
[-c connectionName]
Displays the specified connection information. connectionName is the connection ID. You can also use a partial string of the ID as a variable to retrieve the information.
------------------------------------------------------------------------------
id                ip              port  pool  REQ   REP   PRE   COM   ROL
------------------------------------------------------------------------------
[tmax2.100015]    192.168.33.84   6734  true  0     0     0     0     0
The following describes each information item displayed in the result screen.
Item Description pool
Indicates whether the connection is in the pool.
REQ
Indicates the number of requests sent.
REP
Indicates the number of responses received for the requests.
PRE
Indicates the number of requests for preparing transactions.
COM
Indicates the number of commit requests.
ROL
Indicates the number of rollback requests.
-
[-m]
Displays information about monitoring, fdl files, and logging.
Monitoring --
failback :       false
checkalive :     true
interval :       30

fdl file         null

Logging --
log dir :        D:\tmax
log file :       jtc.log
log buf size :   1024
log valid days   -1
log file format :MMddyyyy
log level :      debug
-
[-g groupName]
Displays information about the specified connection group.
shared connection pool --
tmax2:
host address :   192.168.33.84:6734
backup address : null
user name :      null
user password :  null
domain name      null
domain password  null
init capacity    30
max capacity     30
increment rate   2
max idle time    360000
connect timeout  60
tp timeout       60
tx timeout       180
tx block timeout 60
headertype       3
size             30
support_xa       true
encyption        false
check            true
provision        true
autoclose        true
enable event     false
event flag       0
event Handler    null

clustered connection pool --
------------------------------------------------------------------------------
tmaxc     tmax1,tmax2
------------------------------------------------------------------------------
-
webtinfo
The webtinfo command retrieves general information about WebT connection groups and supports periodic monitoring at regular intervals.
-
Usage
webtinfo [node or container] [-i interval] [-k repeat_number] [webt_name]
Option Description [node or container]
Displays information about the specified node. If the webtinfo command is used without this option, information for all nodes is provided.
If this option is used together with the [-i], [-k] and [webt_name] options, options, a container name must be specified, and information for that container will be displayed.
[-i interval]
Specifies the interval for repeating webtinfo execution. (Unit: seconds)
[-k repeat_number]
Specifies how many times the webtinfo command will be executed. The command will repeat at the interval defined by the [-i interval] option.
[webt_name]
Displays information of the specified connection group.
-
Example
The following shows the result of executing webtinfo.
1 Container Name:Joonsoo-PC_container1
Container Name:Joonsoo-PC_container1
==============================================================================
 ix    name                min    max   step  current  free  max_idle waiting
------------------------------------------------------------------------------
 1     tmax2               30     30    2     30       30    360000   0
==============================================================================
webtinfo2
The webtinfo2 command provides the same functionalities as the webtinfo command of jeusadmin. It allows using the -i and -k options for the specified node.
-
Usage
webtinfo2 [-n node_name] [-c container_name] [-i interval] [-k repeat_count] [-w webt_name]
Option Description [-n node_name]
Specify a node. If not specified, information for all local nodes is retrieved.
[-c container_name]
Specify a container. If used together with -n, this option takes precedence. If not specified, information for all containers will be retrieved.
[-i interval]
Specify the interval as a numeric value. The command waits for the specified duration before the next execution. (Default value: 1)
[-k repeat_count]
Specify the repeat count as a numeric value. (Default value: 1)
[-w webt_name]
Specify a WebT connection group. If not specified, information for all WebT connection groups within the search range will be retrieved.
-
Example
The following shows the result of executing webtinfo2.
1 Container Name:Joonsoo-PC_container1
Container Name:Joonsoo-PC_container1
==============================================================================
 ix    name                min    max   step  current  free  max_idle waiting
------------------------------------------------------------------------------
 1     tmax2               30     30    2     30       30    360000   0
==============================================================================
webtdetailinfo
The webtdetailinfo command displays detailed information for connections in a WebT connection group. It also supports periodic monitoring at regular intervals.
-
Usage
webtdetailinfo container_name webt_name [-i interval] [-k repeat_number]
Option Description [-i interval]
Specifies the interval for repeating webtdetailinfo execution. (Unit: seconds)
[-k repeat_number]
Specifies how many times the webtdetailinfo command will be executed. The command will repeat at the interval defined by the [-i interval].
-
Example
The following shows the result of executing webtdetailinfo.
Container Name:Joonsoo-PC_container1 Webt Name:tmax2
==============================================================================
name            index         Connected Host        Connected Port
==============================================================================
[tmax2.100003]  1             192.168.33.84         6734
[tmax2.100004]  2             192.168.33.84         6734
webtshrink
The webtshrink command reduces the number of connections to the specified min value.
-
Usage
webtshrink [-c container_name] [-w webt_name] [-all]
Option Description [-c container_name]
Specifies the name of the container on which to execute the command.
[-w webt_name]
Specifies the name of the WebT connection group on which to execute the command.
[-all]
Executes the command on all WebT connection groups.
-
Example
The following shows the result of executing webtshrink.
1 Container Name:Joonsoo-PC_container1
webtShrink Joonsoo-PC_container1 successfully
webtreconfig
The webtreconfig reduces the number of failbacks and connections to the specified min value.
-
Usage
webtreconfig [-c container_name] [-w webt_name] [-all]
Option Description [-c container_name]
Specifies the name of the container on which to execute the command.
[-w webt_name]
Specifies the name of the WebT connection group on which to execute the command.
[-all]
Executes the command on all WebT connection groups.
-
Example
The following shows the result of executing webtreconfig.
1 Container Name:Joonsoo-PC_container1
webtreconfig Joonsoo-PC_container1 successfully
3.2. Using JEUS WebAdmin
JEUS provides WebAdmin, a web-based interface for container monitoring. After starting JEUS, open a web browser and enter the following to access the JEUS WebAdmin screen.
http://<ip address>:9744/webadmin
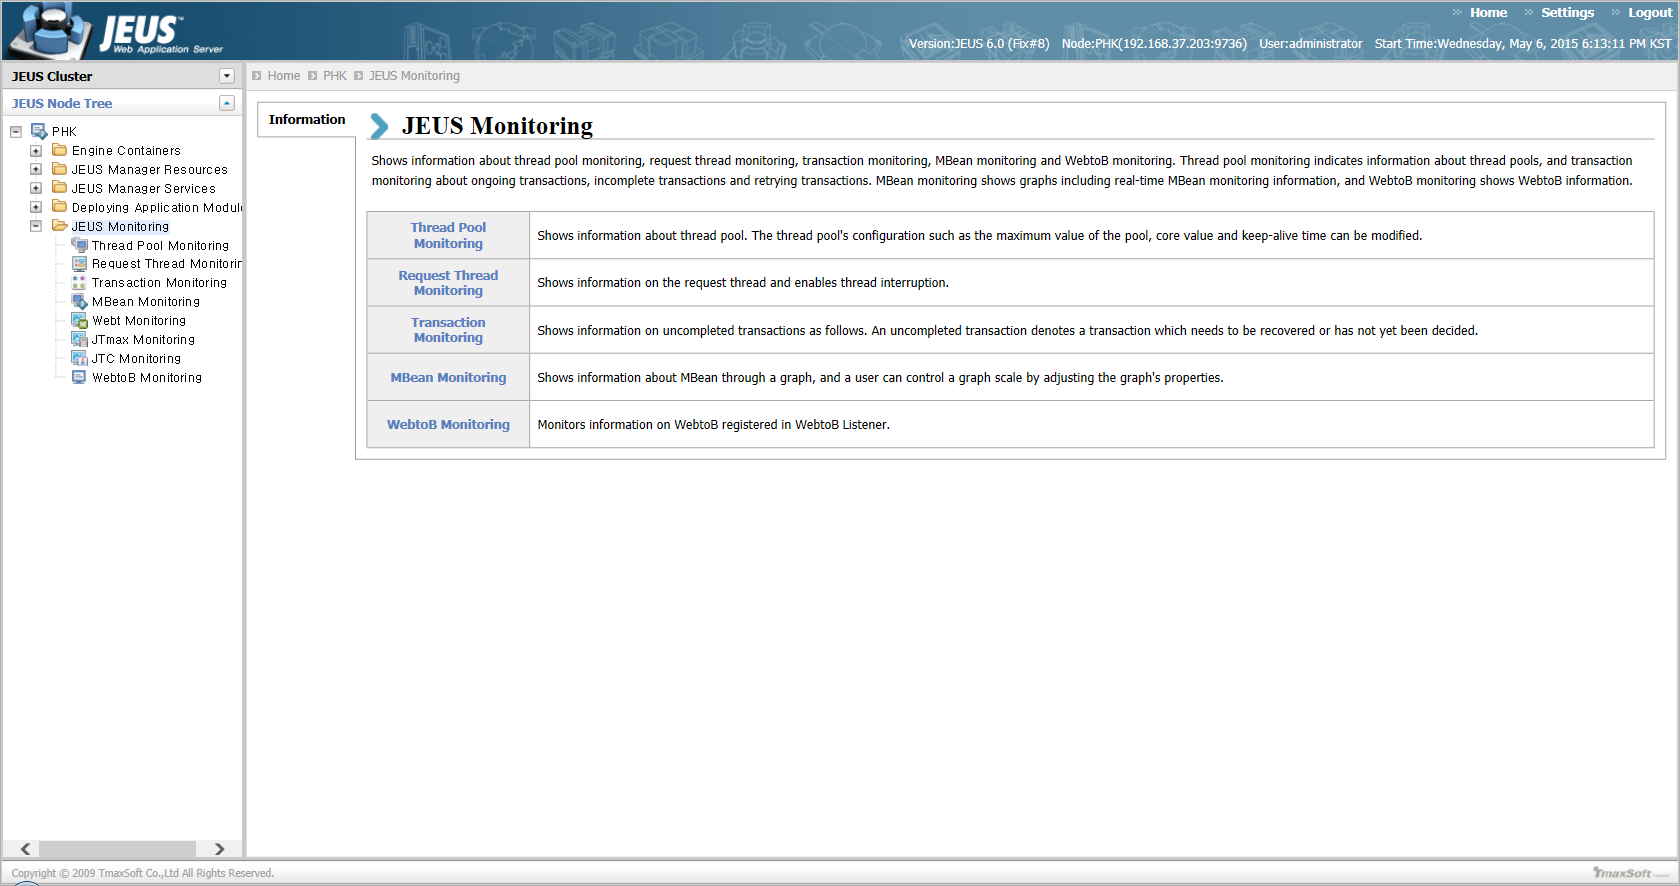
Enter your username and password to log in. After logging in, the following screen appears. On the left of the screen, you can see the Webt, JTmax and JTC monitoring menus under the [JEUS Monitoring] directory of JEUS Node Tree.
|
In the JEUS WebAdmin screen, select [JEUS Monitoring] > [Webt Monitoring] to move on to the Webt Monitoring screen.
The Webt Monitoring screen displays an overview of monitoring, logging, and connection group information.
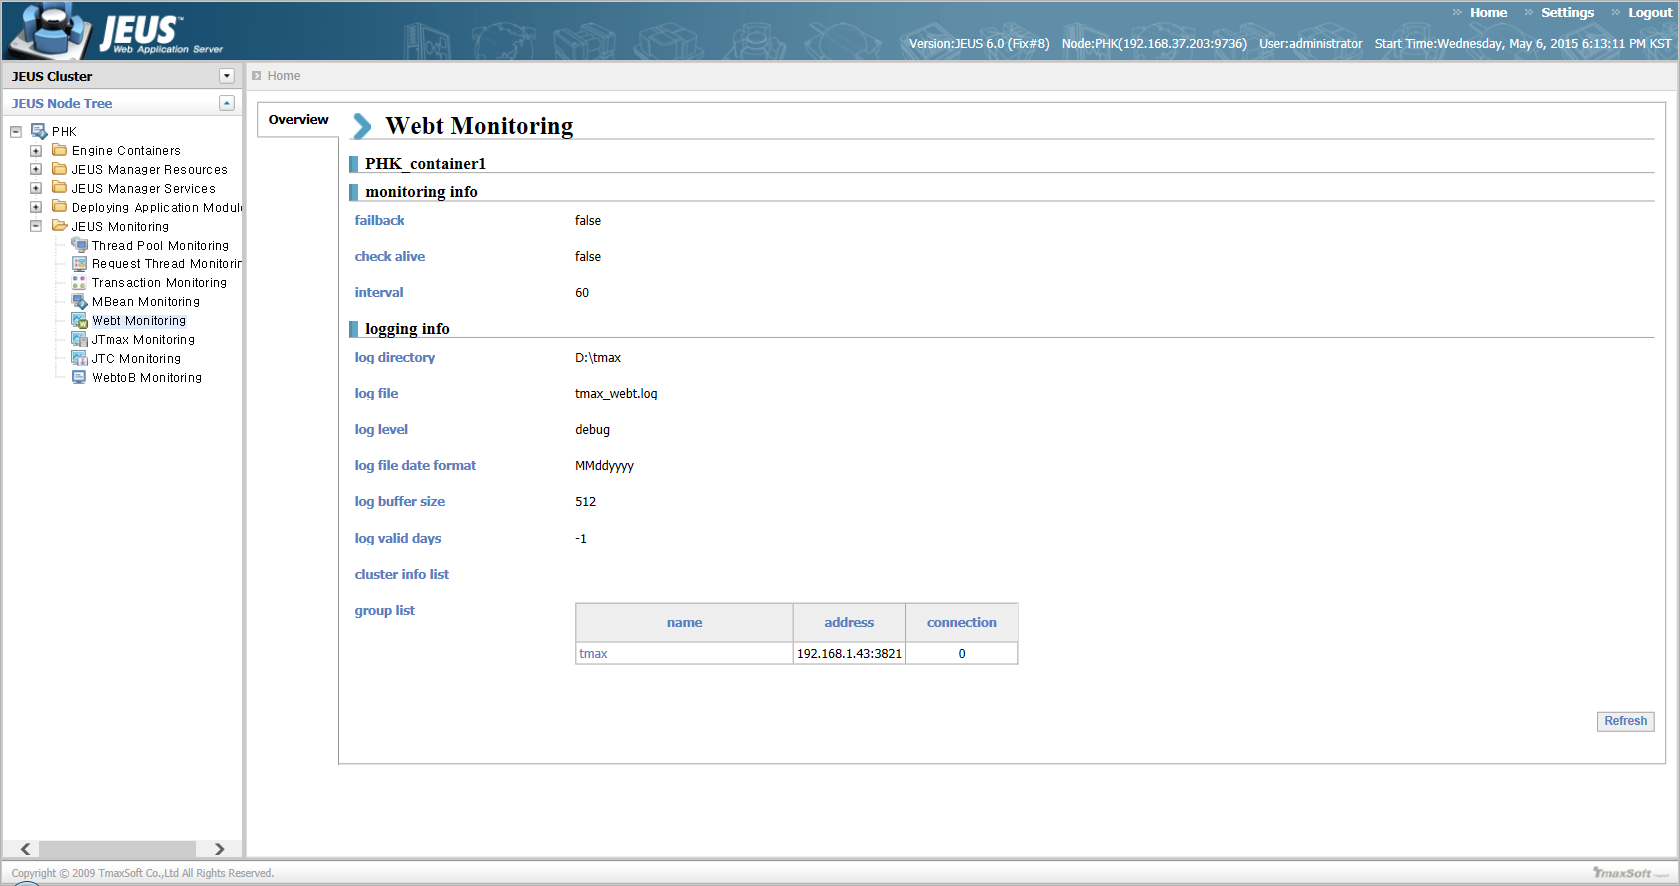
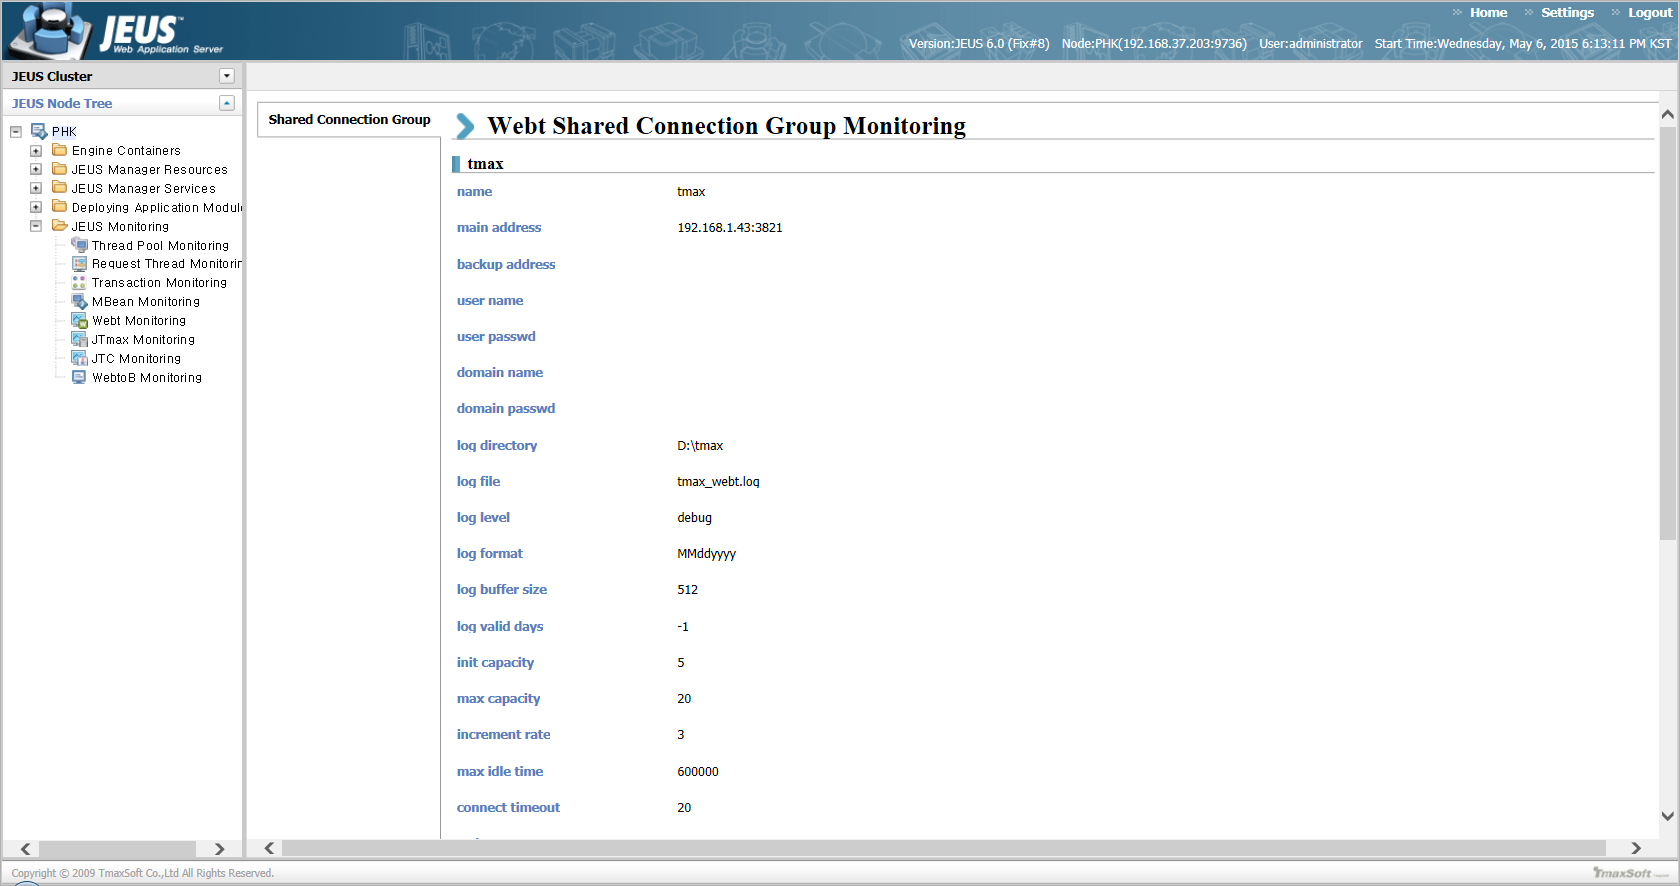
If you select a group name from the 'group list' in the logging info section of the Webt Monitoring screen, the configuration and operation information of the connection group will be displayed.
The following screen shows detailed information for a selected group. The environment configuration settings and their values are based on those defined in the JEUSMain.xml and webt.properties files.
4. JTmax Monitoring
This section describes how to use JTmax monitoring with the JEUS console tool and WebAdmin.
4.1. Using JEUS Console Tool
To monitor JTmax operations using the JEUS console tool, enter the following command to access jeusadmin.
jeusadmin container name -U user name -P user passwd
The jtmaxadmin command in jeusadmin provides monitoring capabilities for JTmax.
jtmaxadmin
The jtmaxadmin command retrieves JTmax status information. The environment configuration settings and their values are based on those defined in the JEUSMain.xml file.
jtmaxadmin does not require any specific options. The following shows an example of its execution result.
NodeName> jtmaxadmin
container name : node_container1
Listen port :

jtmax listen port :     0
min thread :            2
max thread :            4
increment :             2
period :                600000

Logging :

log directory :         d:\
log file :              jtmax.log
log buffer size :       512
log file format :       MMddyyyy
log level :             debug
log valid days :        1

General Infomation :

fdl file :              c:\\tmax\\tmax.fdl
default character set : null

EJB Infomation :
------------------------------------------------------------------------------
service name        export name         method name         call count
------------------------------------------------------------------------------
JTOUPPER4           echotest            ToUpper             0
TPCALLCARRAY_J      tpcall              tpcallCarray        0
JTOUPPER3           echotest            ToUpper             0
JTOUPPER2           echotest            ToUpper             0
ECHOCHAR_J          echo                echoChar            0
JTOUPPER1           echotest            ToUpper             0
ECHOSHORT_J         echo                echoShort           0
TPCALLFIELD_J       tpcall              tpcallField         0
FDLINSERT_J         tpcall              tpcallFdlInsert     0
ECHOLONG_J          echo                echoLong            0
GSVC03              echotest            setStringEcho2      0
ECHOFLOAT_J         echo                echoFloat           0
GSVC02              echotest            setIntEcho          0
ECHOINT_J           echo                echoInt             0
GSVC01              echotest            setStringEcho       0
INSERT_J            echo                insert              0
TPCALLSTRING_J      tpcall              tpcallString        0
ECHODOUBLE_J        echo                echoDouble          0
ECHOSTRING_J        echo                echoString          0

Condition :

request :       0
reply :         0
prepare :       0
commit :        0
rollback :      0
4.2. Using JEUS WebAdmin
To monitor JTmax operations using JEUS WebAdmin, open a web browser and enter the following to access the JEUS WebAdmin screen.
http://<ip address>:9744/webadmin
In the JEUS WebAdmin screen, enter your username and password to log in. Since the post-login screen, along with its menus and information, has already been described earlier, it will not be repeated here. For details, see Using JEUS WebAdmin.
|
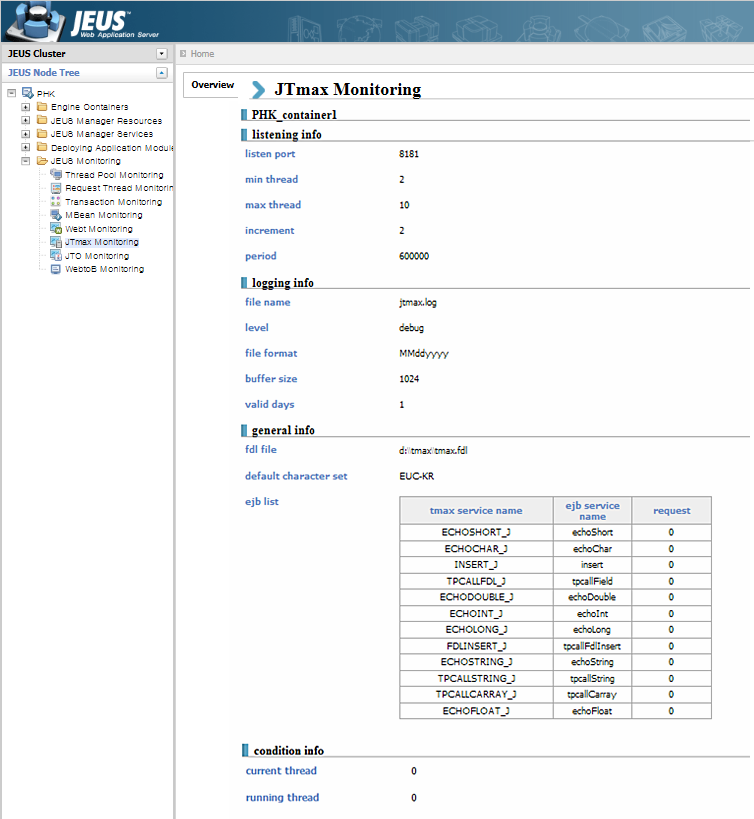
In the JEUS Node Tree on the left side of the JEUS WebAdmin screen, select [JEUS Monitoring] > [JTmax Monitoring] to open the JTmax Monitoring screen, shown as follows. This screen displays JTmax monitoring and operation information. The environment configuration settings and their values are based on those defined in the JEUSMain.xml file.