Key Features
This chapter describes the menus of WebAdmin and how to use them.
1. System Search/Control
In [System Settings], you can check the current WebtoB configuration and connected client information. This is similar to using the wsadmin config command. For more information about the command, refer to config (cfg) in WebtoB Administrator’s Guide.
Click [Node] from the navigation pane to display the list of nodes.
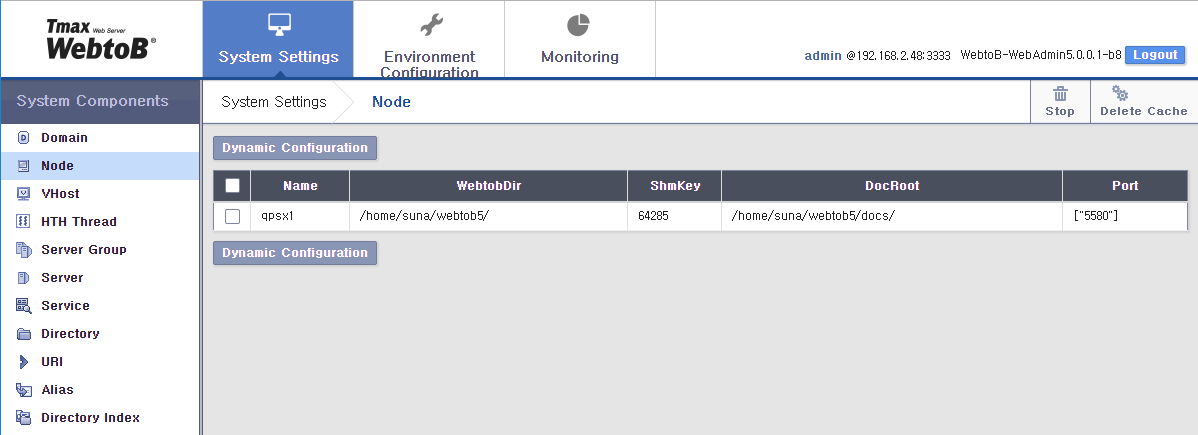
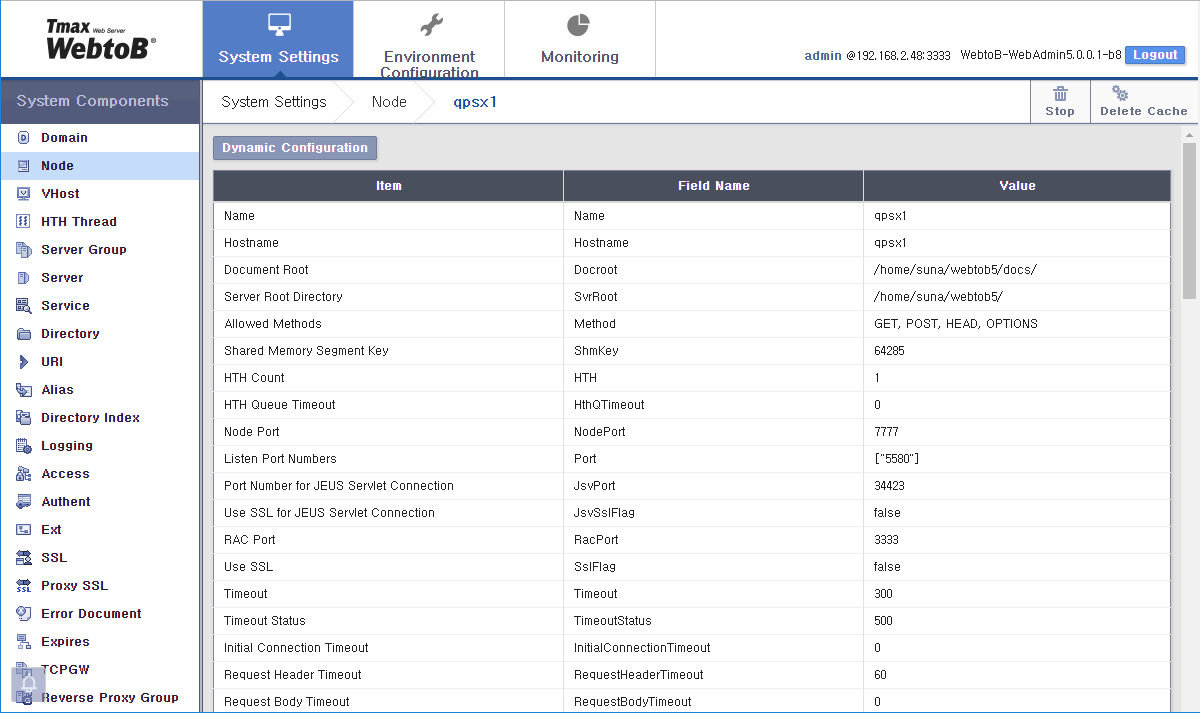
Click a node name to display more information about the node. For information about each item, refer to NODE Section in WebtoB Administrator’s Guide.
|
You can view information about each system component. For information about individual settings, refer to Configuration Items in WebtoB Administrator’s Guide. |
Dynamic Settings
Some settings can be changed dynamically. Settings that can be changed dynamically do not require restart of WebtoB. Dynamic configuration changes have the same effect as using the wsadmin set command. For more information about using this command, refer to set in WebtoB Administrator’s Guide.
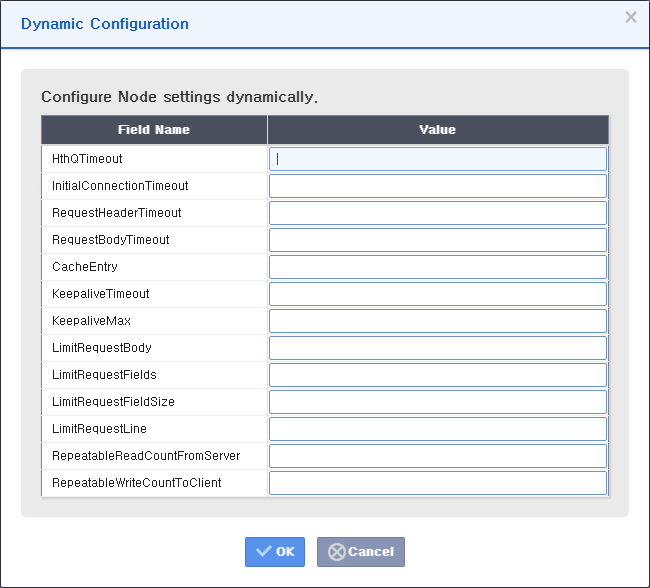
Click [Dynamic Configuration] at the top left to open the following window:
To change an item, enter a value and then click [OK] to apply the changes.
2. Environment Configuration
In [Environment Configuration], you can view, add, or modify each item in the current WebtoB configuration file.
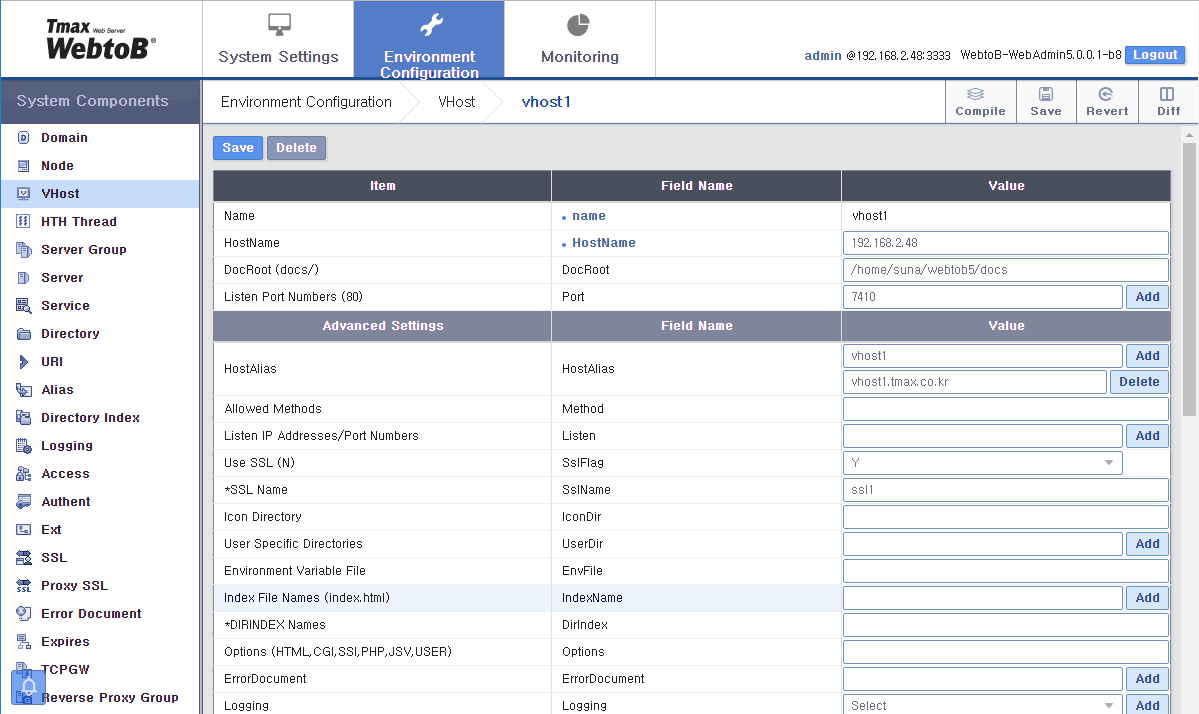
Click [VHost] from the navigation pane to display the list of vhosts.
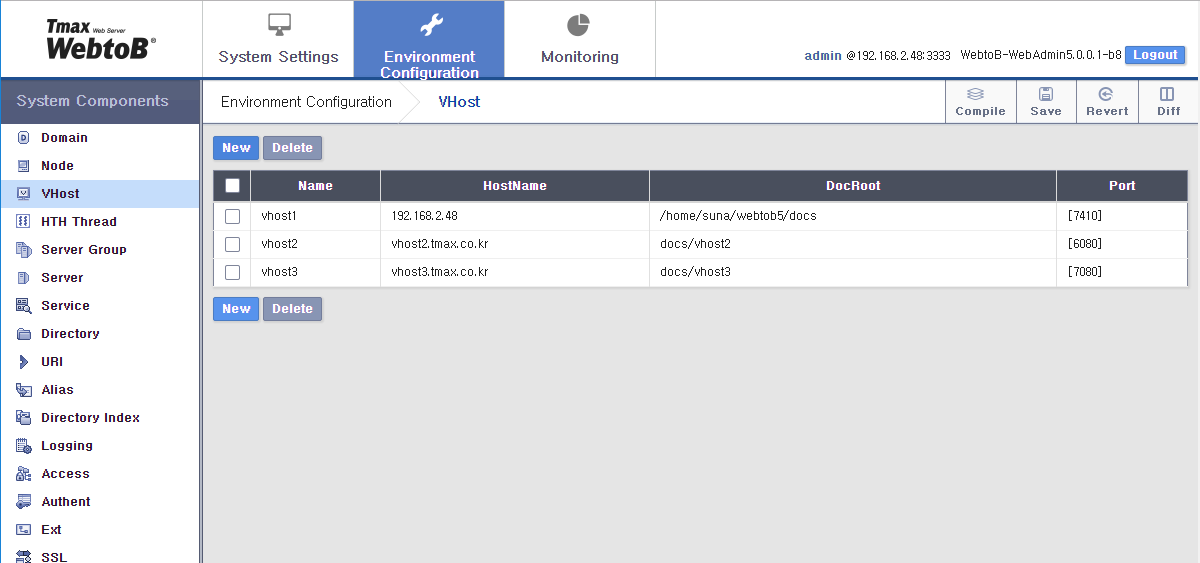
Click a vhost name to view its current settings in the environment file. For more information about each items, refer to Configuration Items in WebtoB Administrator’s Guide.
You can manage all vhost settings in the configuration file.
2.1. Adding a Configuration
The following describes how to add an environment file.
-
Under System Components, select a component to add to the environment file.
 Adding a WebAdmin Environment Configuration (1)
 -
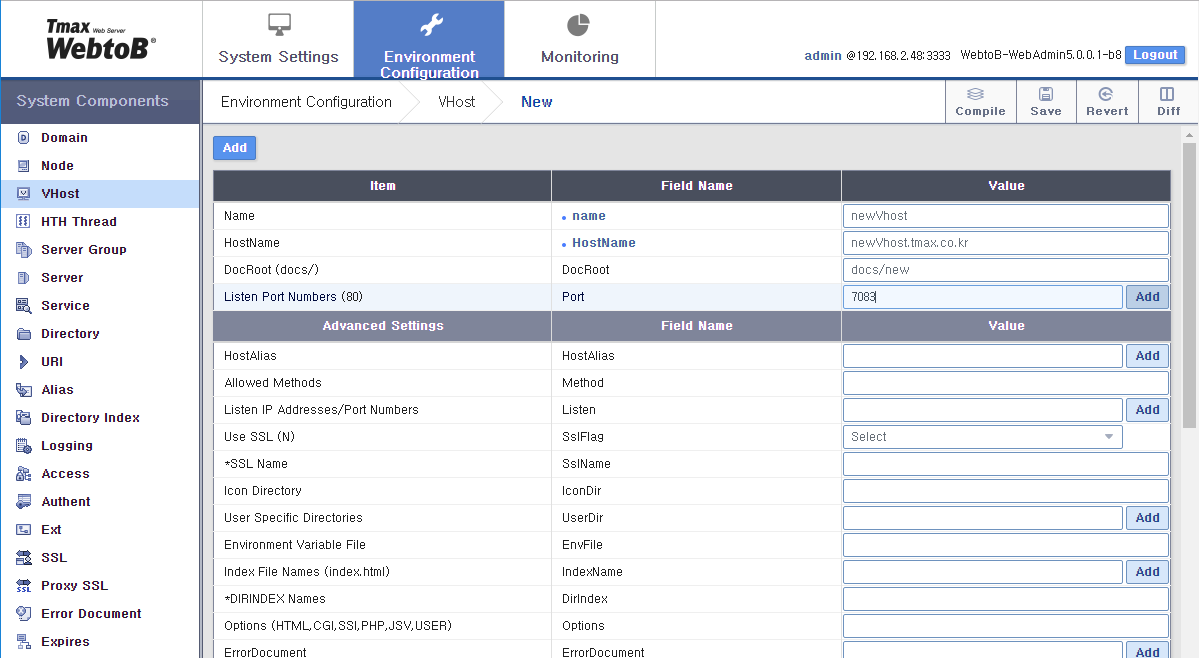
Click [New] at the top left of the page.
 Adding a WebAdmin Environment Configuration (2)
 -
Enter all required fields, and then click [Add].
 Adding a WebAdmin Environment Configuration (3)
 -
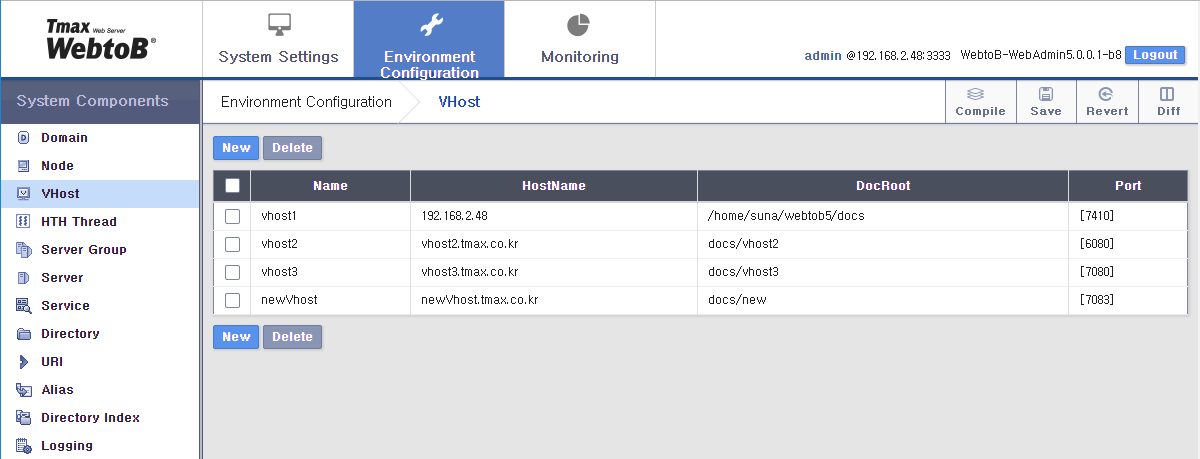
After adding the configuration, click [Save].
-
Click [Compile] to apply the changes.
2.2. Changing a Configuration
The following describes how to modify an environment file.
-
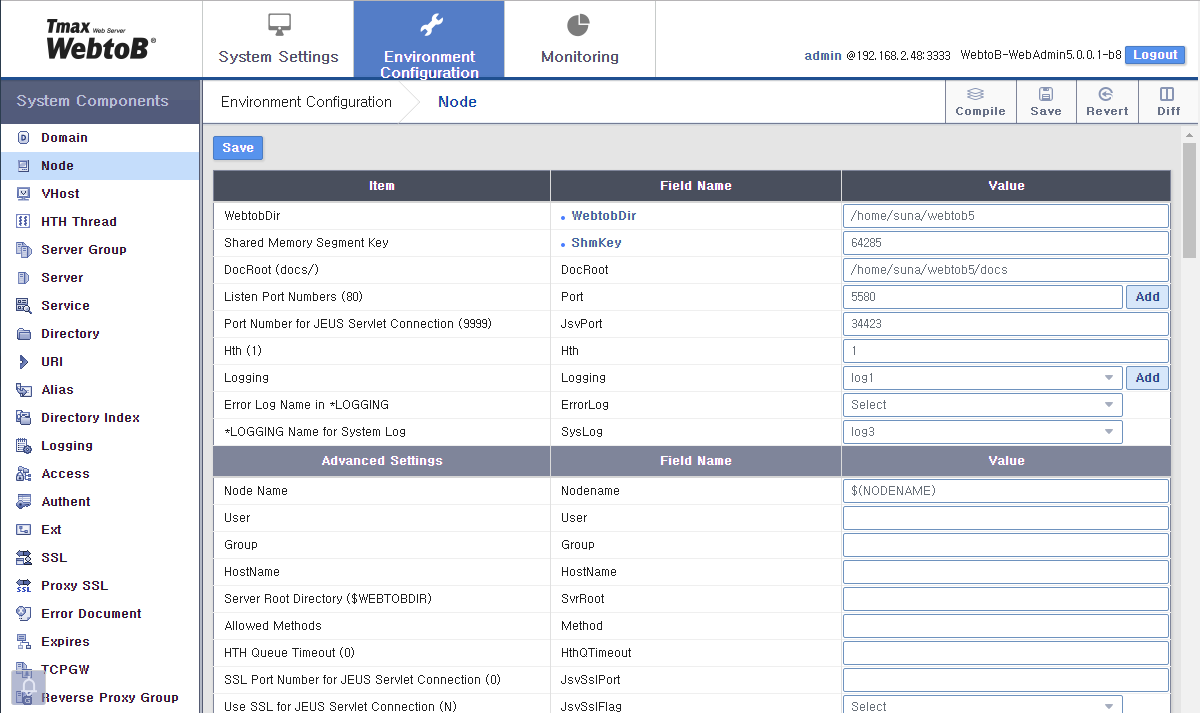
Under System Components, select a component to modify in the environment file. Modify the desired items, and then click [Save].
 Changing a WebAdmin Environment Configuration
 -
To compare the changed file with the original file, click [Diff] on the right to display the following page.
Click [Revert] to revert back to the original configuration.
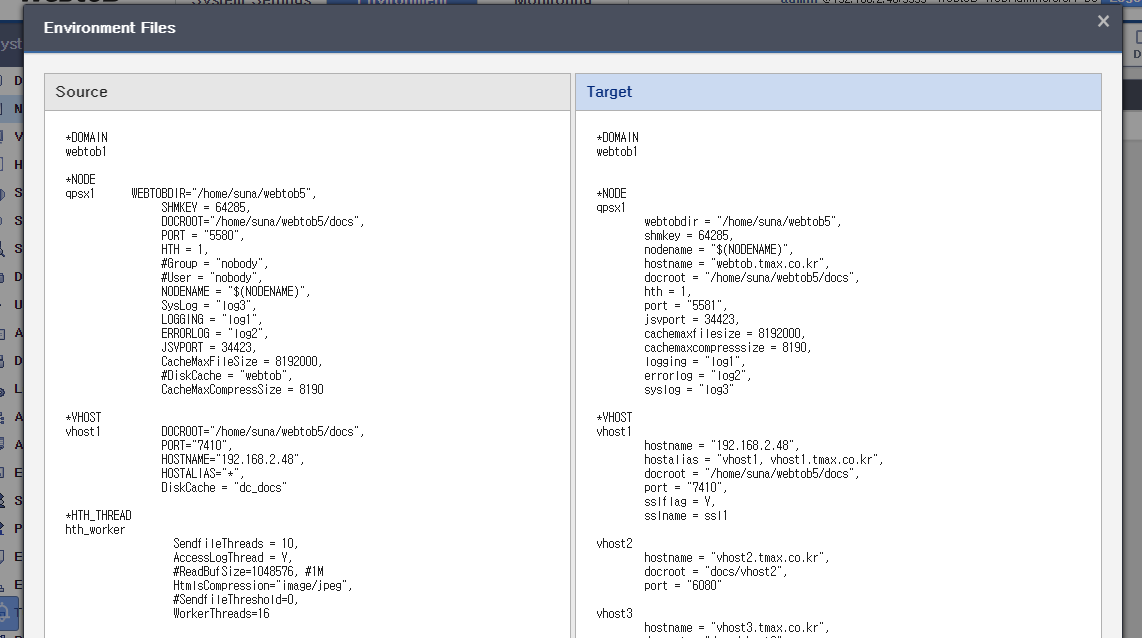 Changing a WebAdmin Environment Configuration - Diff
 -
When you are finished with making changes, click [Save].
-
Click [Compile] to save the changes.
3. Monitoring
In [Monitoring], you can check the current number of requests processed by WebtoB, as well as the status of individual servers.
Click a menu from the navigation pane. To automatically refresh the monitoring data at a set interval, click [Monitoring] at the top right and then enter a refresh interval in the page displayed.
3.1. Node
Click [Node] from the navigation pane to view node statistics.
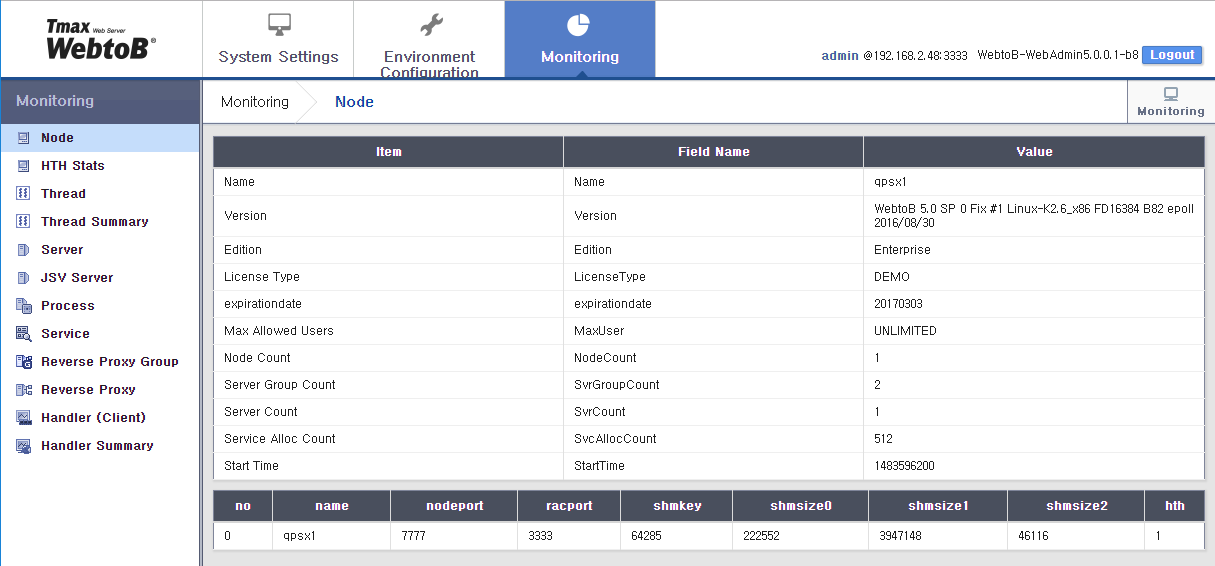
The following describes some items on this page.
| Item | Description |
|---|---|
shmkey |
SHMKEY value of the NODE section. |
shmsize |
Actual shared memory size. |
3.2. HTH Statistics
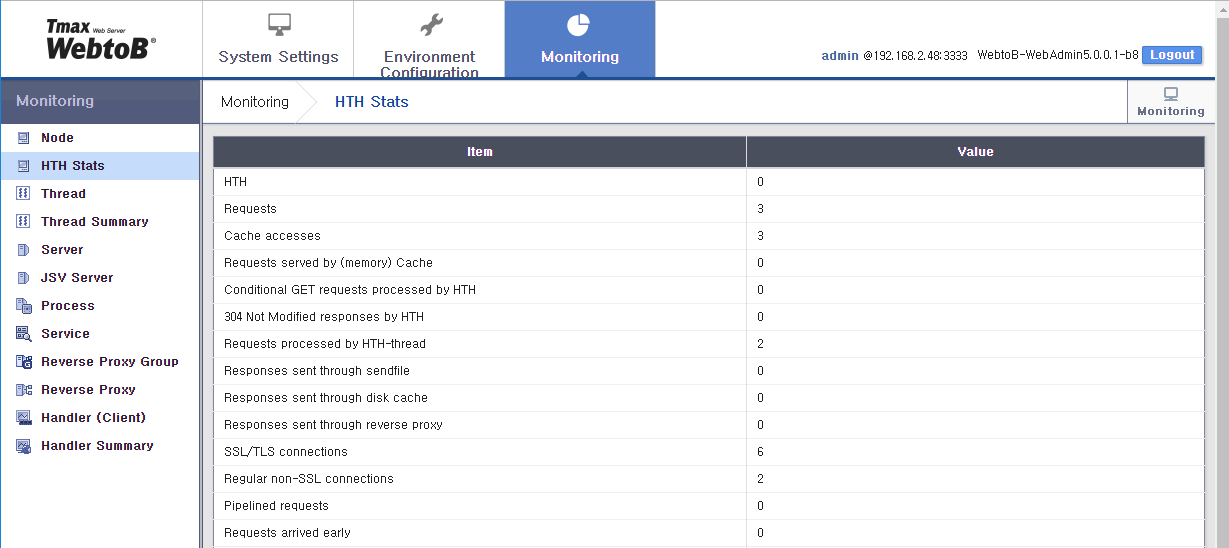
Under Monitoring, click [HTH Stats] to view HTH statistics. You can also view this information by using the wsadmin stat -h command. For more information, refer to stat (st) in WebtoB Administrator’s Guide.
3.3. Thread
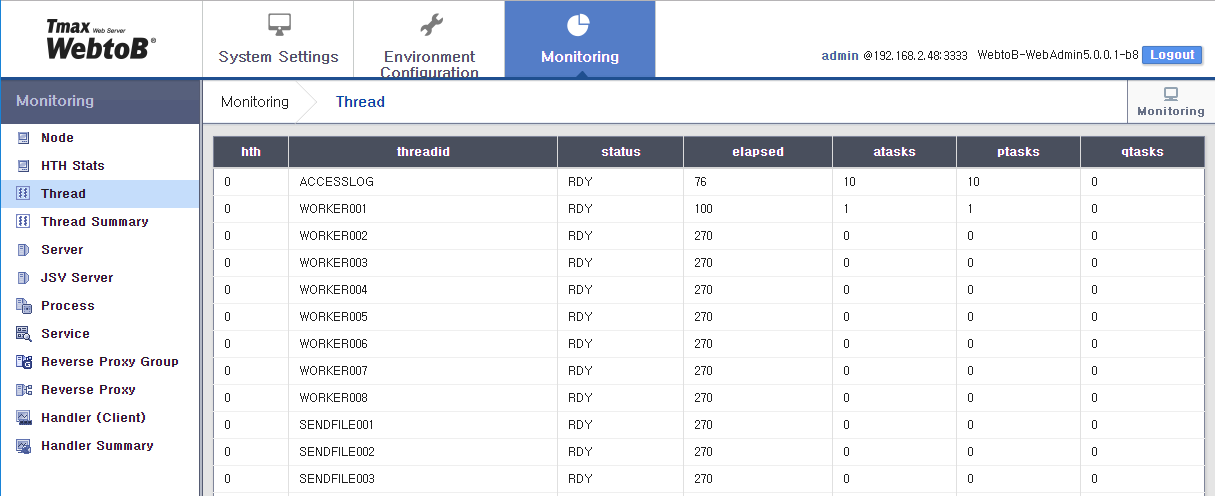
Click [Thread] from the navigation pane to view thread statistics. You can also view this information by using the wsadmin stat -t command. For more information, refer to stat (st) in WebtoB Administrator’s Guide.
| Item | Description |
|---|---|
hth |
HTH number. |
threadid |
Thread name. |
status |
Current status. One of:
|
elapsed |
Amount of time passed since the start or end of a task. |
atasks |
Total number of tasks. |
ptasks |
Number of tasks processed up to now. |
qtasks |
Number of tasks currently in the queue. |
3.4. Thread Summary
Click [Thread Summary] from the navigation pane to view tread statistics. You can also view this information by using the wsadmin stat -T command. For more information, refer to stat (st) in WebtoB Administrator’s Guide.
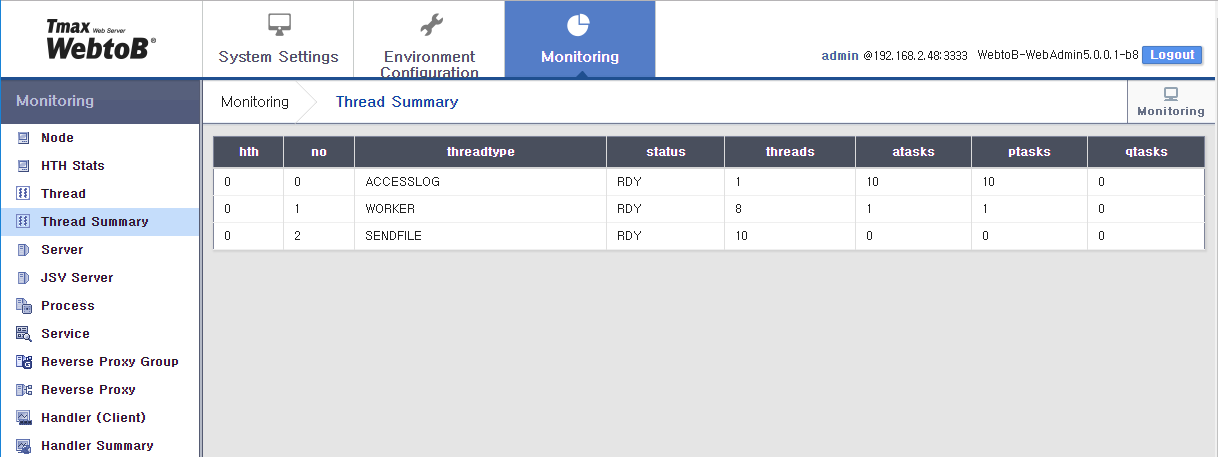
| Item | Description |
|---|---|
hth |
HTH number. |
threadtype |
Type of thread. |
status |
Current status. One of:
|
threads |
Number of threads of the threadtype. |
atasks |
Total number of tasks. |
ptasks |
Number of tasks processed up to now. |
qtasks |
Number of currently queued requests. |
3.5. Server
Click [Server] from the navigation pane to view server statistics. You can also view this information by using the wsadmin svrinfo command. For more information, refer to svrinfo (si) in WebtoB Administrator’s Guide.
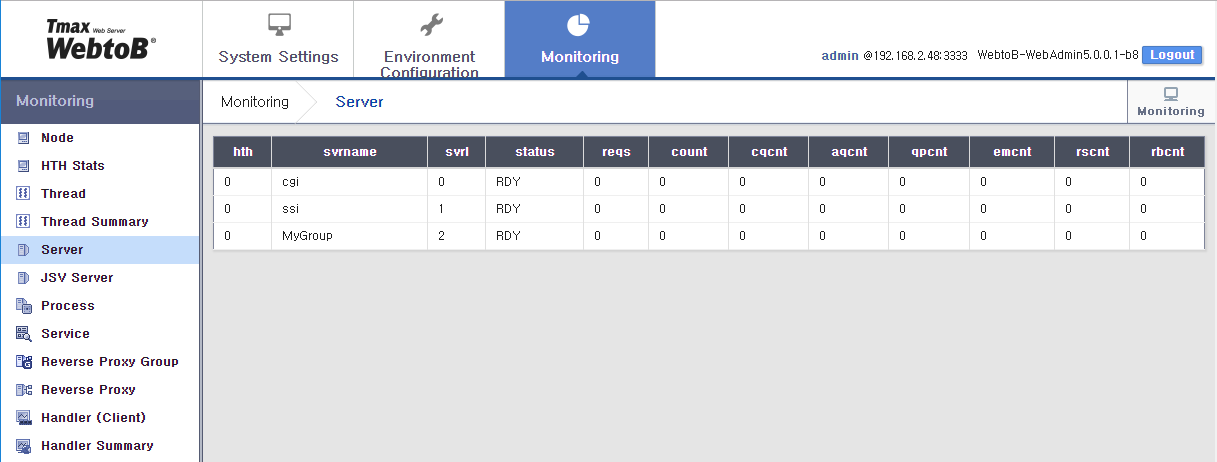
| Item | Description |
|---|---|
hth |
HTH number. |
svrname |
Server name set in the environment configuration. |
svri |
Server index number. |
status |
Server status.
|
reqs |
Number of requests sent to the server. |
count |
Number of requests processed. |
cqcnt |
Number of currently queued requests. |
aqcnt |
Number of cumulative queued requests. |
qpcnt |
Number of requests removed from queue due to a timeout or qp command. |
emcnt |
Number of queued requests that exceeds MaxQCount. |
rscnt |
Number of restarts caused by abnormal termination of the server. |
rbcnt |
Number of reboots via rbs command. |
3.6. JSV Server
Click [JSV Server] from the navigation pane to view JSV server statistics. You can also view this information by using the wsadmin stat -j command.
For more information, refer to stat (st) in WebtoB Administrator’s Guide.
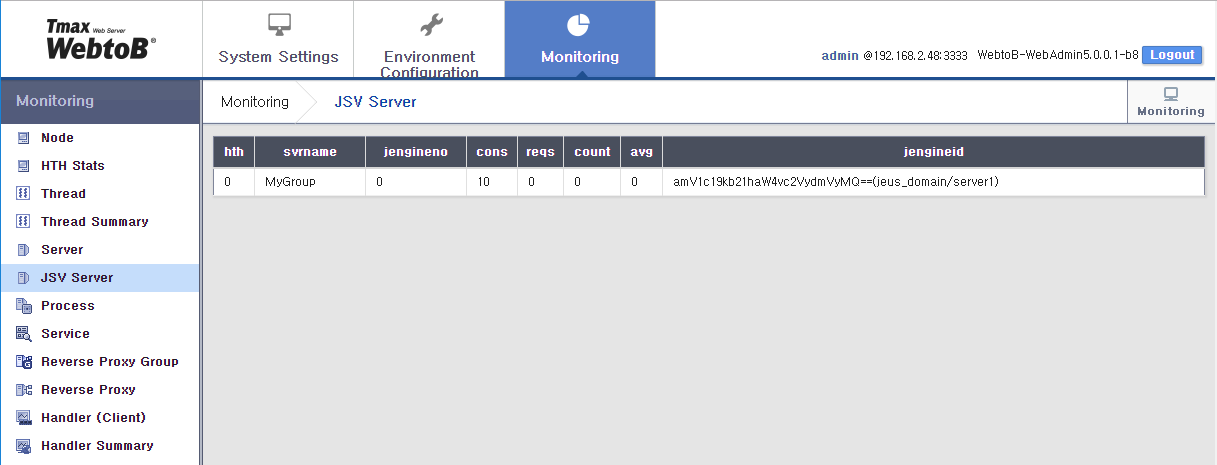
| Item | Description |
|---|---|
hth |
HTH number. |
svrname |
Server name set in the environment configuration. |
jengineno |
Engine number specified in JEUS. |
cons |
Number of JEUS connections. |
reqs |
Number of requests sent to the server. |
count |
Number of requests processed. |
avg |
Average processing time. |
jengineid |
Name of JEUS Servlet engine connected to WebtoB. |
3.7. Process
Click [Process] from the navigation pane to view process statistics. You can also view this information by using the wsadmin stat -p command. For more information, refer to stat (st) in WebtoB Administrator’s Guide.
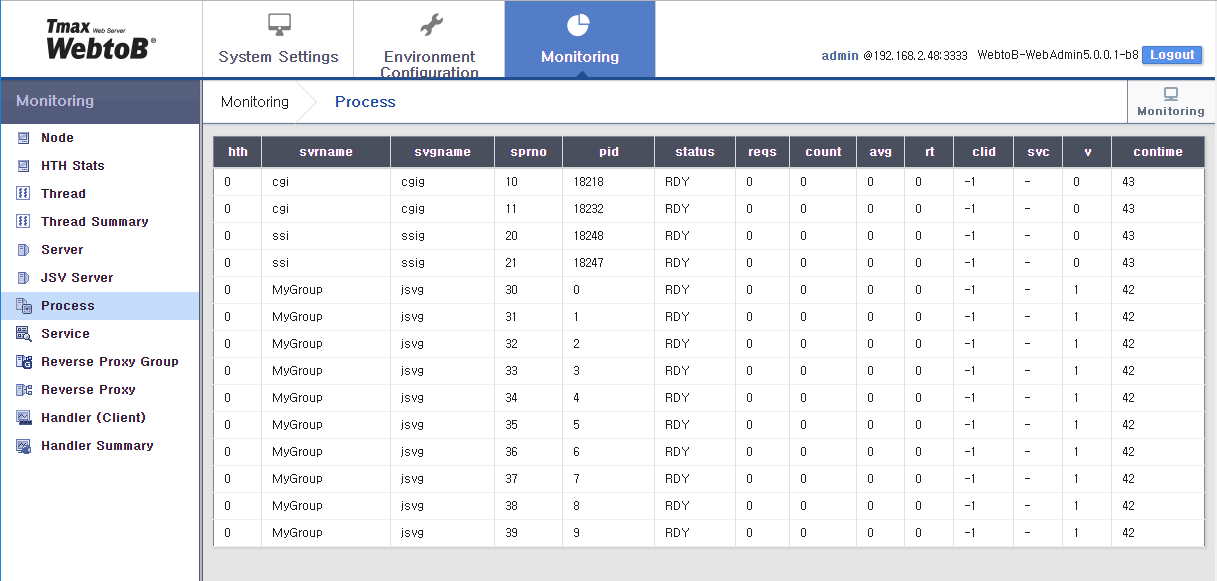
| Item | Description |
|---|---|
hth |
HTH number. |
svrname |
Server name set in the SERVER section. |
svgname |
Server group name of the SVRGROUP section. |
sprno |
Process number set in WebtoB. |
pid |
Process ID. For JVS servers, this is the ID received from the worker thread for each connection. |
status |
Process status.
|
reqs |
Number of requests sent to the process. |
count |
Number of requests processed by the process. |
avg |
Average processing time. (Unit: second) |
rt |
Time consumed by the currently processed request. |
clid |
Client ID of the current request. |
svc |
Service name of EXT or URI of the current request. |
v |
WJP (WebtoB-JEUS Protocol) version information for a JEUS connection. Internal server processes are indicated with a '0'. |
contime |
Time elapsed since the process was connected to HTH (duration connected to HTH). |
3.8. Service
Click [Service] from the navigation pane to view service statistics. You can also view this information by using the wsadmin stat -s command.
For more information, refer to stat (st) in WebtoB Administrator’s Guide.
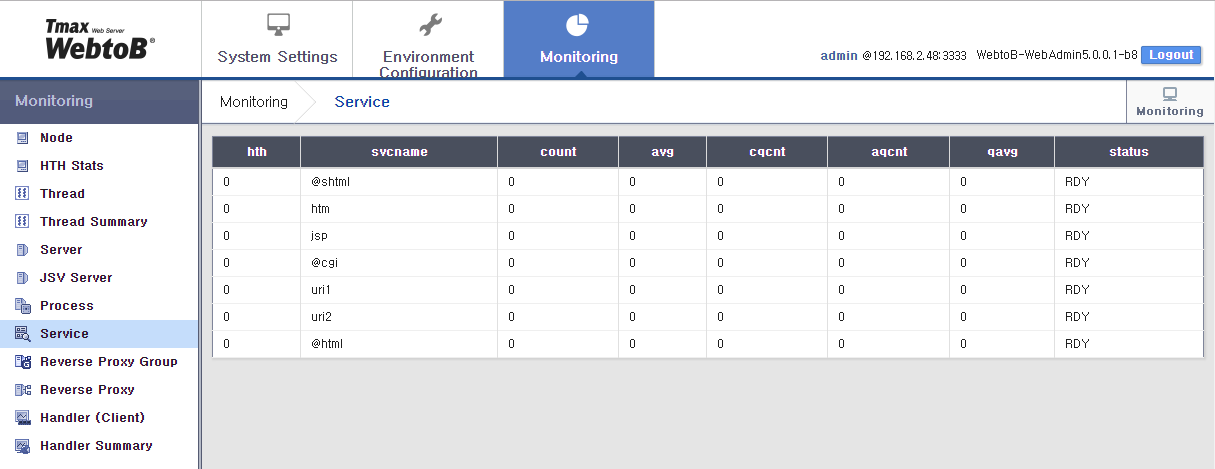
| Item | Description |
|---|---|
hth |
HTH number. |
svrname |
Server name set in the SERVER section. |
count |
Number of requests processed by WebtoB for this service. |
avg |
Number of requests processed by the server. |
cqcnt |
Number of currently queued requests. |
aqcnt |
Number of cumulative queued requests. |
qavg |
Average queued time. |
status |
Current status.
|
3.9. Reverse Proxy Group
Click [Reverse Proxy Group] from the navigation pane to view reverse proxy group statistics. You can also view this information by using the wsadmin stat -rpg command.
For more information, refer to stat (st) in WebtoB Administrator’s Guide.
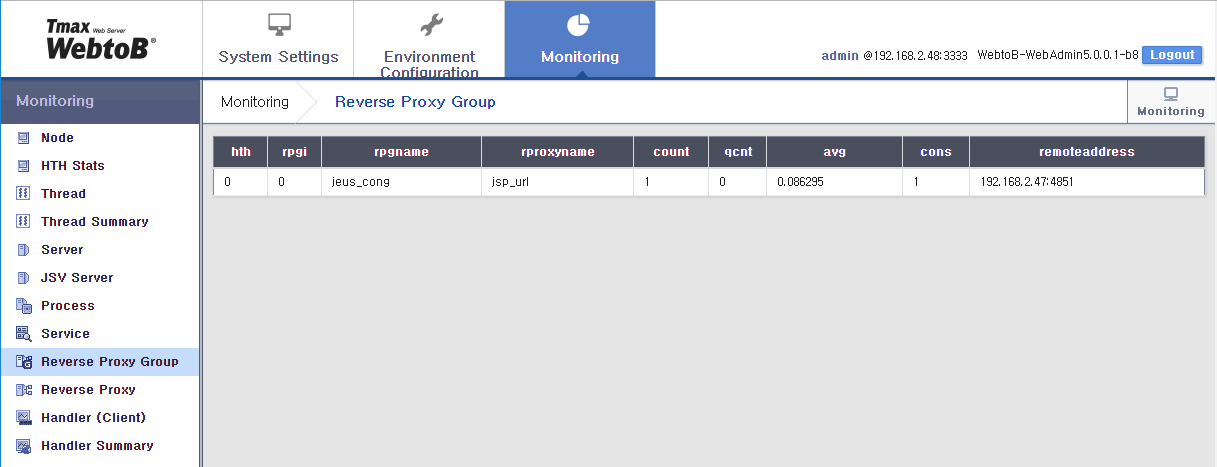
| Item | Description |
|---|---|
hth |
HTH number. |
rpgi |
Reverse proxy group number. |
rpgname |
Reverse proxy group name. |
rproxyname |
Reverse proxy name. |
count |
Number of requests processed. |
qcnt |
Number of requests queued for the proxy group. |
avg |
Average processing time. (Unit: second) |
cons |
Number of WAS connections. |
remoteaddress |
Client IP and port. |
3.10. Reverse Proxy
The following page is displayed when selecting [Reverse Proxy] under Monitoring. You can al so view this information by using the wsadmin stat -rp command. For more information, refer to stat (st) in WebtoB Administrator’s Guide.
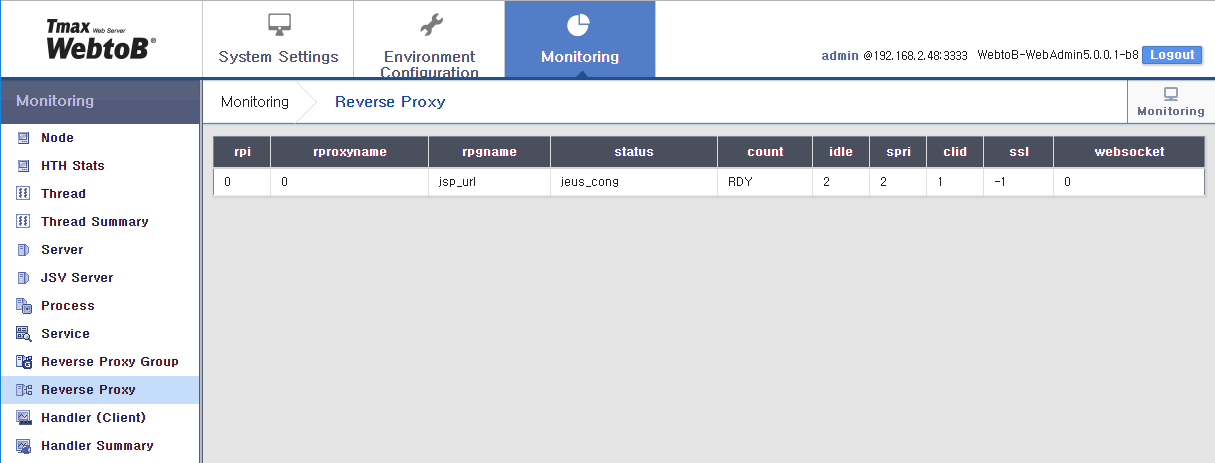
| Item | Description |
|---|---|
hth |
HTH number. |
rproxyname |
Reverse proxy name. |
rpgname |
Reverse proxy group. |
status |
Connection status.
|
count |
Number of requests processed. |
idle |
Idle time. (Unit: second) |
spri |
Connection index number. |
clid |
Client ID of the current request. |
ssl |
Whether or not SSL is in use. |
websocket |
Whether or not web socket is in use. |
3.11. Handler (Client)
Click [Handler (Client)] from the navigation pane to view client handler statistics. You can also view this information by using the wsadmin cliinfo command. For more information, refer to cliinfo (ci) in WebtoB Administrator’s Guide.
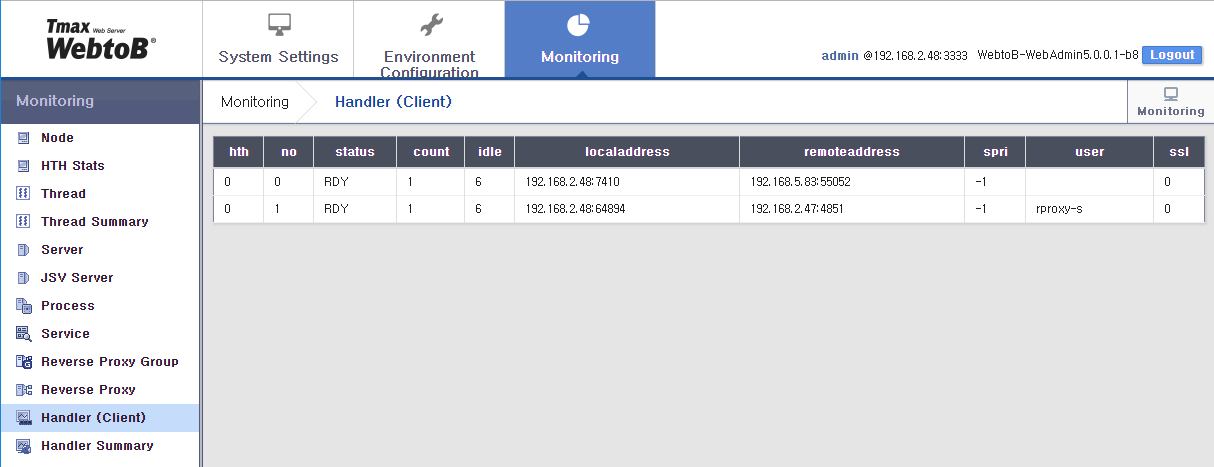
| Item | Description |
|---|---|
hth |
HTH number. |
status |
Client status.
|
count |
Number of requests sent by the client. |
idle |
Idle time. (Unit: second) |
localaddress |
WebtoB server address. |
remoteaddress |
Address of the connected client. |
spri |
Server process processing a request (-1 means that a process has not been allocated yet). |
user |
User name of the request. |
ssl |
Whether or not the client is connected via SSL. |
3.12. Handler Summary
Click [Handler Summary] from the navigation pane to view client handler statistics of client requests by processing state. You can also view this information by using the wsadmin cliinfo -S command.
For more information, refer to cliinfo (ci) in WebtoB Administrator’s Guide.
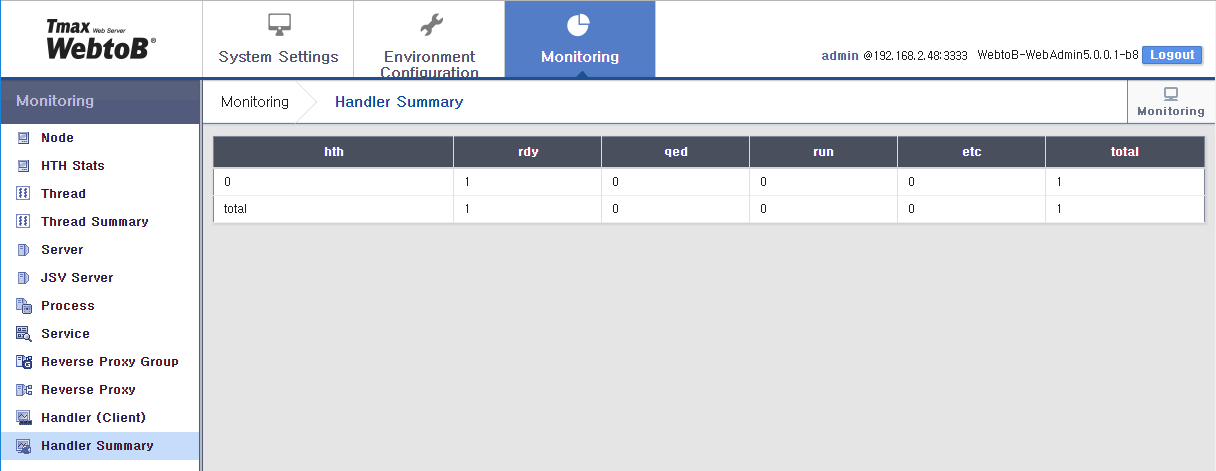
| Item | Description |
|---|---|
hth |
HTH number. |
rdy |
Number of incoming client requests. |
qed |
Number of currently queued requests because all target servers are currently busy processing requests. |
run |
Number of client requests being processed. |
etc |
Number of client requests in a state other than ready, run, and queued states. |
total |
Total number of incoming or already received client requests. |