Dashboard
The 'Dashboard' screen, which is the initial screen of OpenFrame Refactor, provides an overview of the composition and status of all assets at a glance. This allows you to intuitively understand the analysis status, issues, progress, and more.
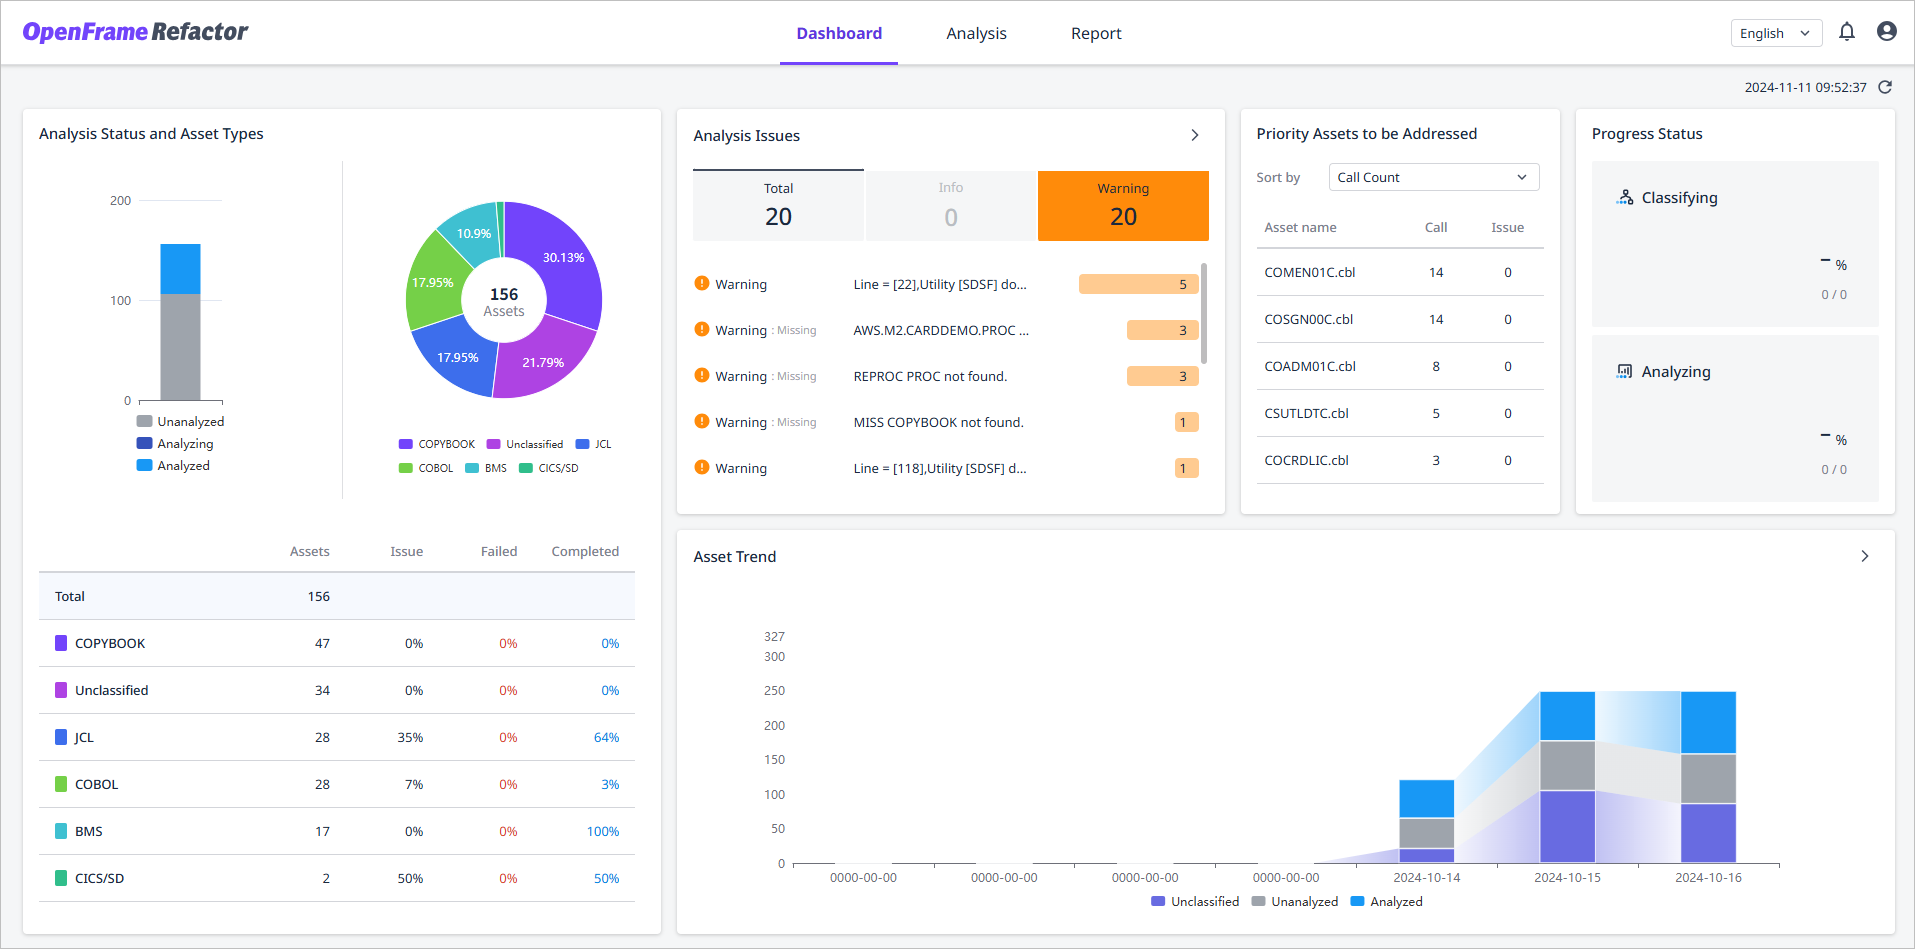
At the top right of the 'Dashboard' screen, you can also check the date and time when the data was collected. When you click the ![]() button, the chart on the dashboard will be redrawn, and the date and time information will also be updated to reflect the refreshed time.
button, the chart on the dashboard will be redrawn, and the date and time information will also be updated to reflect the refreshed time.

|
You can go to the Dashboard screen by clicking the |
Analysis Status and Asset Types
The 'Analysis Status and Asset Types' section provides the analysis status and asset type information for all assets uploaded to a directory.
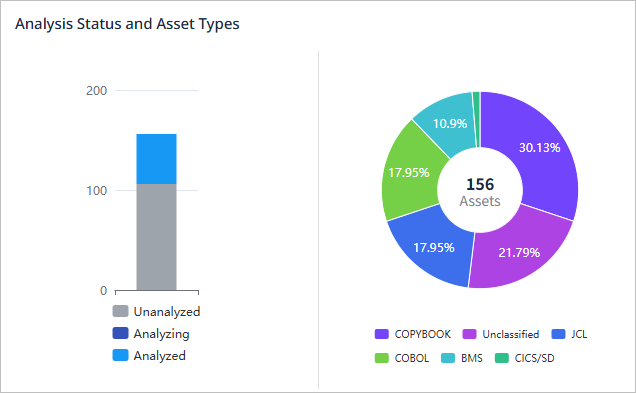
The following describes information provided in each chart
| Chart | Description |
|---|---|
Bar Chart |
The ratio and number of assets by analysis status |
Donut Chart |
The ratio and number of assets by asset type |
Additionally, in the table below the chart, you can see detailed information about the assets for which analysis has been conducted.
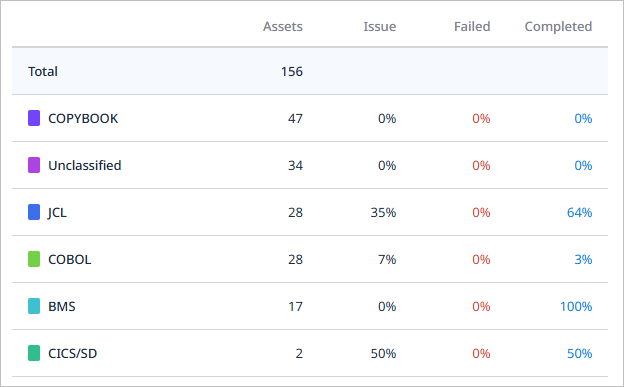
| Item | Description |
|---|---|
Assets |
Number of assets |
Issue |
Rate of asset analysis issues |
Failed |
Asset analysis failure Rate |
Completed |
Asset analysis completion rate |
Analysis Issues
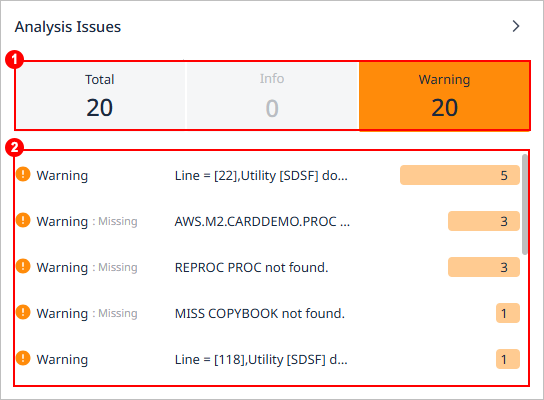
The 'Analysis Issues' section provides information about issues that occurred during the analysis process.
-
① Total Occurrences
Displays a summary of issues by level. Clicking each item reorders the issue rankings based on the selected level. Only one item can be selected at a time, with 'Total' selected by default.
Item Description Total
Aggregates the total number of occurrences including all issues.
Info
Aggregates issues that arise for informational purposes.
Warning
Aggregates warning issues that indicate potential problems.
The 'Info' is an issue level used to identify assets that contain specific patterns specified by the user.
-
② Issue Ranking
Displays issues in order of frequency of occurrence based on issue level, message, and number of occurrences.
Priority Assets
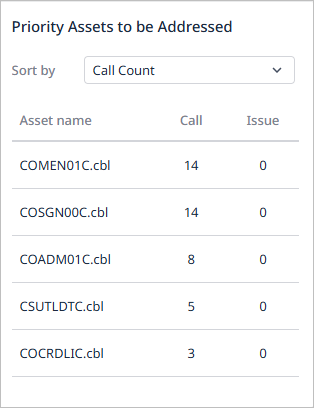
The 'Priority Assets to be Addressed' section provides a list of the top five assets that need to be addressed first, based on the number of calls and the number of issues.
You can select either ‘Call Count’ or ‘Issue Count’ as the sorting criteria.
| Item | Description |
|---|---|
Asset Name |
Name of the asset |
Call |
Number of calls made for the asset |
Issue |
Number of issues related to the asset |
Progress Status
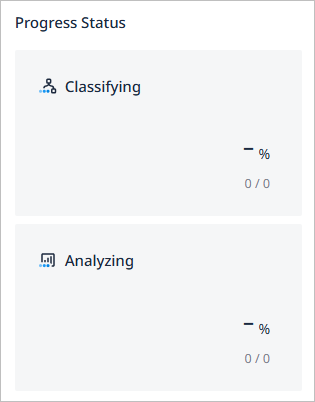
The 'Progress Status' section provides progress information for each step of an asset.
| Item | Description |
|---|---|
Classifying |
Progress of the asset classification |
Analyzing |
Progress of the asset analysis |
Asset Trend
The 'Asset Trend' section provides asset count for the past 7 days (including today). Today’s data is based on the current time, while data for previous days is provided based on 11:00 PM each day.

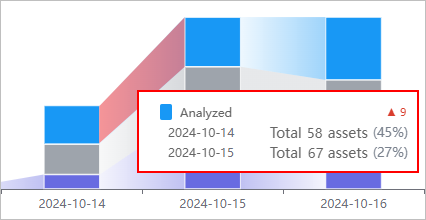
Each bar is separated by asset status. Hovering over a bar displays the number of assets in that status and the total number of assets for that day.
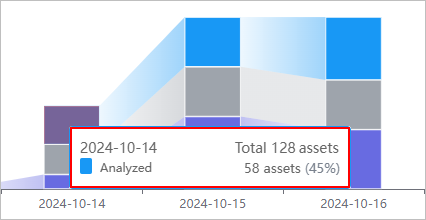
Additionally, the change between bars is represented by the size of the area, and hovering over the area displays the amount of change.
