Viewing Reports
Viewing Report List
You can view the list of generated reports.
-
Select the [Reports] menu from the top navigation bar.
-
A full list of generated reports is displayed on the left panel.
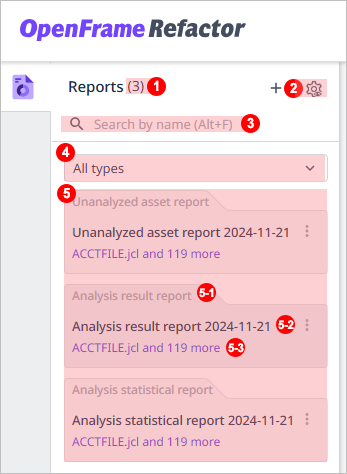
Item Description ①
The number of displayed reports.
②
Button to set the sorting method for the list. Click this button to set the sorting criteria.
-
Most Recent: Sorted by most recently created reports.
-
Report Type: Sorted by the report type selected from the type filter drop-down list.
-
Name: English names in ascending order, followed by Korean names in ascending order
③
Search area. Enter a 'report name', and only matching results will be displayed.
④
Type filter. Click to filter the list based on the type of report selected from the drop-down list.
⑤
List of reports. The list includes (5-1) report type, (5-2) report name, and (5-3) asset name.
-
Viewing Report Details
You can check the details of the generated report.
-
Select the [Reports] menu from the top navigation bar.
-
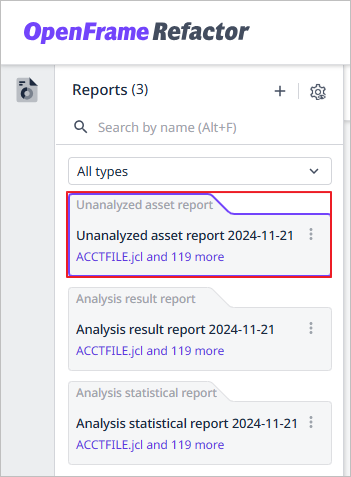
Select a specific report from the report list.
-
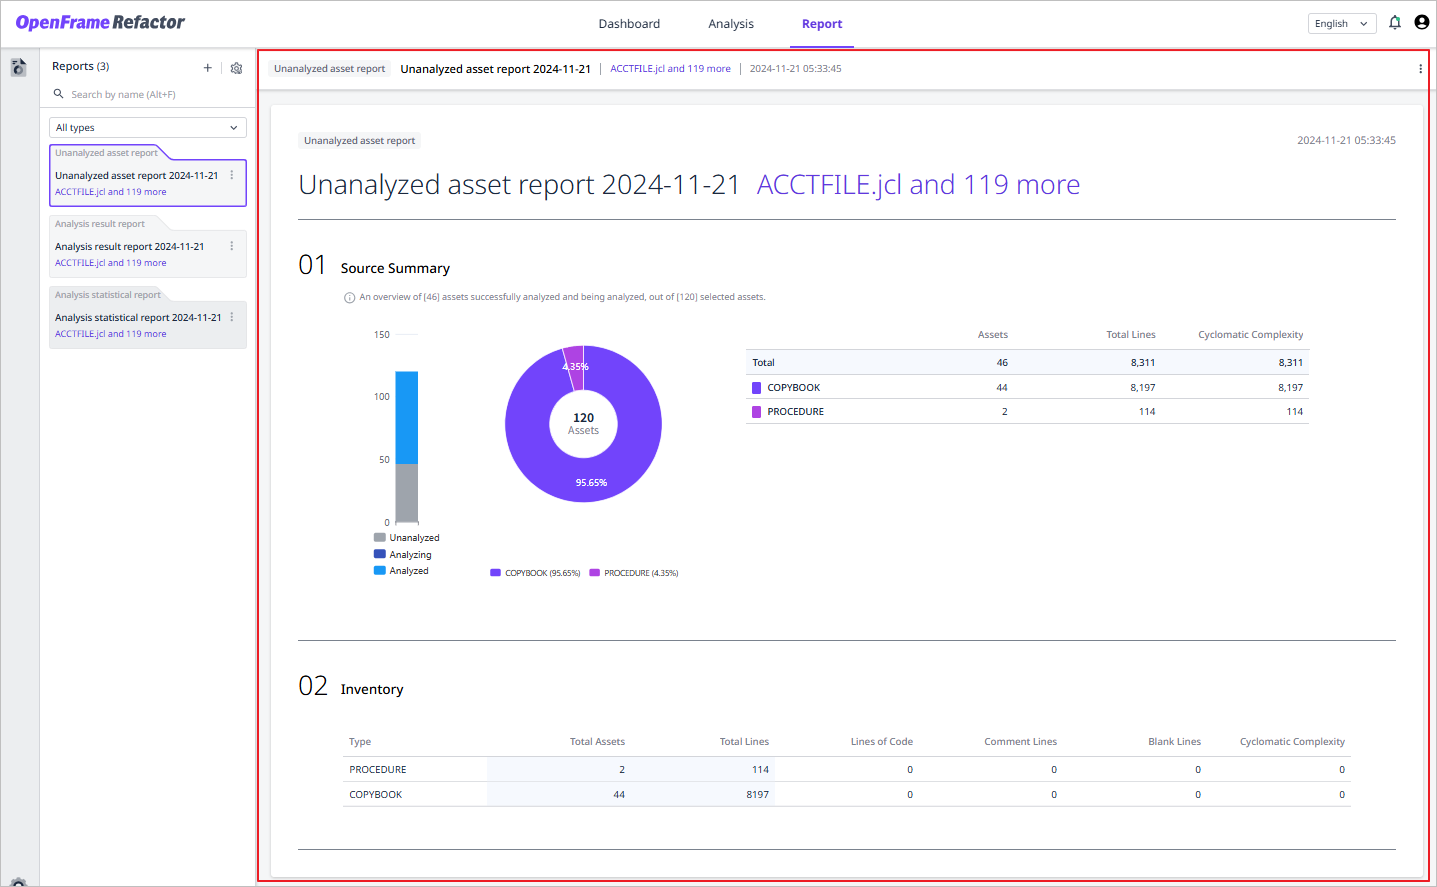
When the details of the selected report are displayed on the screen, you can check detailed information about the selected report type and content.
Analysis Results Report
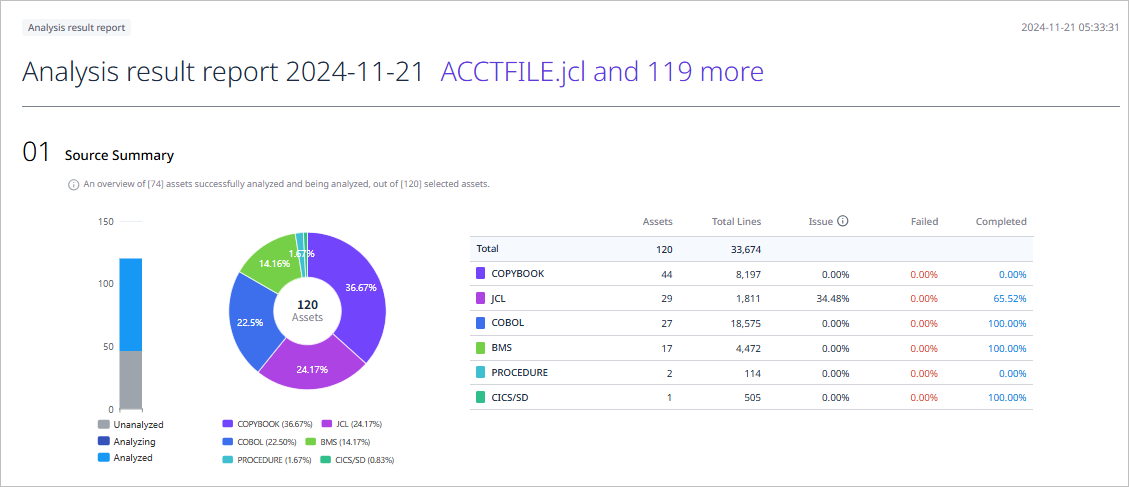
Provides analysis results for the analyzed assets by asset type, along with complexity level and tag information.
-
Source Summary
Summary information about the analytical assets included in the report.
Item Description Bar Chart
Percentage of assets for each analysis progress status
Donut Chart
Proportion of assets by asset type
Table
Issue occurrence rate of the asset
-
Assets: Number of assets
-
Total Lines: Total source code lines for the asset
-
Issue: Issue occurrence rate of the asset
-
Failed: Analysis failure rate
-
Completed: Analysis success rate
-
-
Tag
Asset count by each tag.
-
Inventory
Overall information of analyzed assets, including asset types, analysis status, and issue occurrence information.
Item Description Type
Type of asset
Total Assets
The total number of assets
Total Lines
The total source code lines for the asset
Analyzing Assets
The number of assets currently being analyzed
Analyzed Assets
The number of assets for which analysis has been completed
Total Issues
The total number of issues
Missing Assets
The number of assets missing during analysis
Failed Assets
The number of assets where analysis failed
-
Issue
Detailed information about all issues discovered during analysis.
Item Description Level
Severity or importance level of the issue
Type
Type of the issue
Total Issues
Total number of issues that occurred in the analyzed assets
Assets with Issues
The number of assets where issues were found
Unanalyzed Asset Report
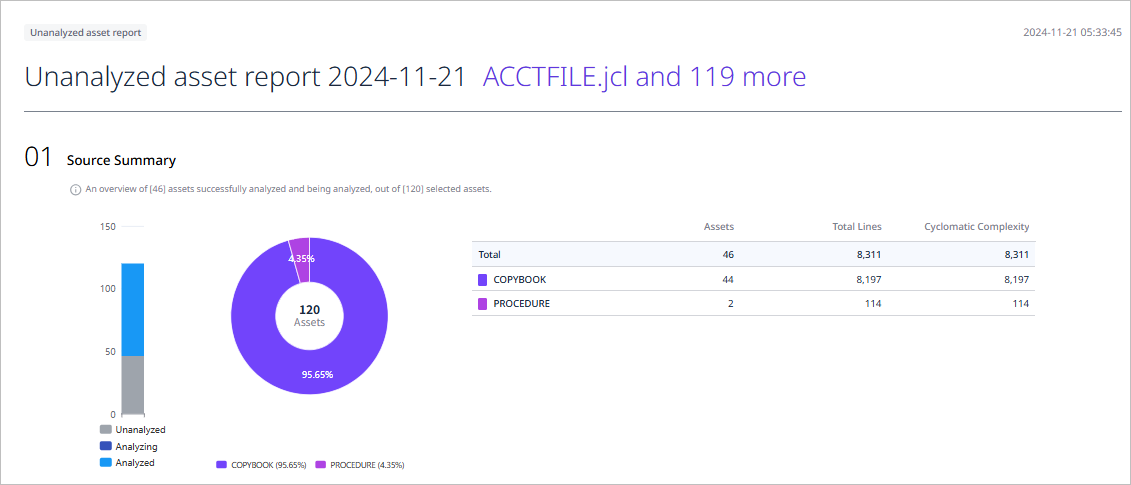
Provides information on unanalyzed assets by asset type.
-
Source Summary
Summary information on unanalyzed assets included in the report.
Item Description Bar Chart
Percentage of assets for each analysis progress status
Donut Chart
Proportion of assets by asset type
Table
Information related to the asset’s source code
-
Assets: The number of assets
-
Total Lines: The total source code lines for the asset
-
Cyclomatic Complexity: Complexity of the source code
-
-
Inventory
A complete overview of unanalyzed assets, including type and source code information.
Item Description Type
Type of asset
Total Assets
The total number of assets
Total Lines
The total source code lines for the asset
Lines of Code
The number of executable lines in the asset
Comment Lines
The number of comment lines in the asset
Blank Lines
The number of blank lines in the asset
Cyclomatic Complexity
Complexity of source code
Analysis Statistical Report
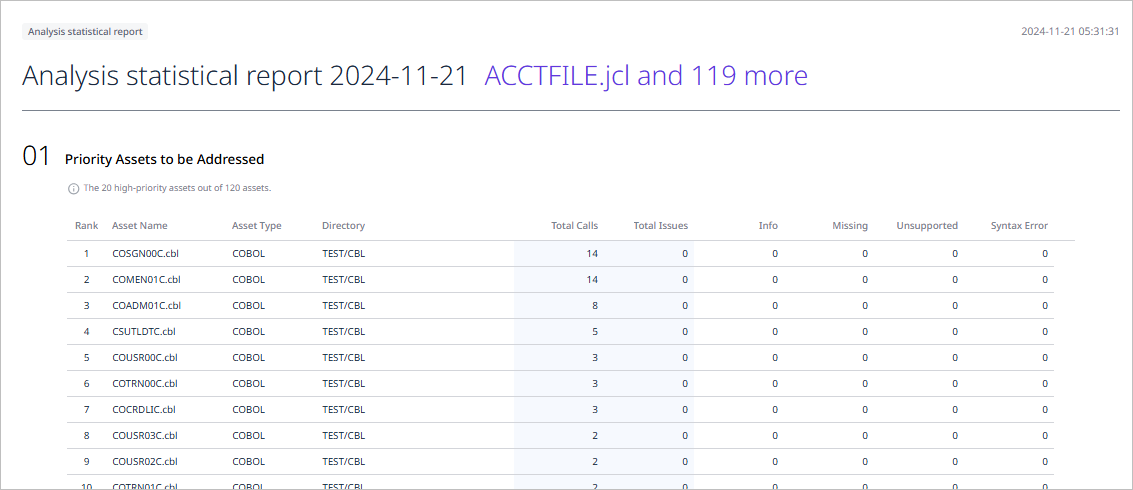
Provides rankings of analyzed assets based on issue occurrences and call counts, as well as a list of priority assets requiring issue resolution.
-
Priority Assets to be Addressed
Order of assets that require prompt resolution of issues.
Item Description Rank
Priority of issue resolution
Asset Name
Name of the asset
Asset Type
Type of asset
Directory
Directory where assets are stored
Total Calls
Total number of times the asset was called
Total Issues
Total number of issues found in the asset
Info
Number of 'Info' issues
Missing
Number of 'Missing' issues
Unsupported
Number of 'Unsupported' issues
Syntax Error
Number of 'Syntax Error' issues
-
Assets with the Most Issues
Order of assets with the most issues.
Item Description Rank
The order of assets with the most issues
Asset Name
Name of the asset
Asset Type
Type of asset
Directory
Directory where assets are stored
Total Issues
Total number of issues found in the asset
Info
Number of 'Info' issues
Missing
Number of 'Missing' issues
Unsupported
Number of 'Unsupported' issues
Syntax Error
Number of 'Syntax Error' issues
-
Assets with the Most Calls
Order of assets with the most calls.
Item Description Rank
The order of assets with the most calls
Asset Name
Name of the asset
Asset Type
Type of asset
Directory
Directory where assets are stored
Total Calls
Total number of times the asset was called
Opening Reports in New Window
You can check the detailed information of the generated report in a new window.
-
Select the [Reports] menu from the top navigation bar.
-
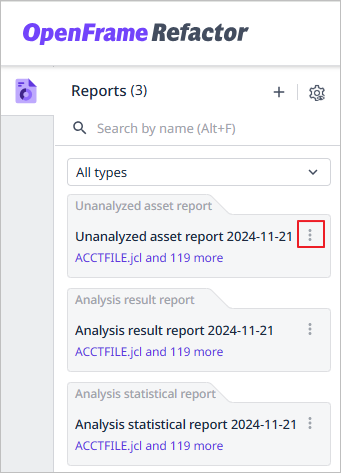
Select the
 icon of a specific report from the list.
-
Select the [Open in New Window] menu from the drop-down list.
-
The report details will appear in a new window.
- ☞ Learn more
-
You can also open the report in a new window using the following method:
-
Click the
 button in the upper right corner of the report detail page, and select the [Open in New Window].
-