Monitoring
This chapter describes the functions and uses of the [Monitoring] menu, which is used to monitor and trace various execution details.
1. Overview
The [Monitoring] menu is used to monitor and trace various execution details. To enable [Monitoring], click [Configuration] > [Log Configuration], and then set the transaction log level to be TRACE or higher. (Log configurations other than at the system level will be supported in the future.)
The following are the monitoring functions. Refer to each section for more information about the functions and usage of each item.
| Menu | Description |
|---|---|
Displays the details of transactions executed in AnyLink based on logs. |
|
Searches for transaction trace log by using message contents. |
|
Sets the statistics of the BizTxs executed in AnyLink and displays the results. |
|
Displays thread pools to allocate to a Biz System in real time. |
|
Displays messages in a message queue. |
|
Displays system status. |
|
Displays adapter status for each Biz System. |
|
Checks batch progress. |
Monitoring Icons
The following describes each icon used in [Monitoring].
| Icon | Description |
|---|---|
|
Flow. |
|
User-defined class. |
|
Indicates that an inbound adapter is receiving data. |
|
Indicates that an inbound adapter is sending data. |
|
Indicates that a flow is processing. |
|
Indicates that an outbound adapter is sending data. |
|
Indicates that an outbound adapter is receiving data. |
|
Indicates that an error occurs. |
|
Checks transaction trace messages. |
2. Biz System
The [Biz System] menu is used to view and monitor the flow from an inbound adapter to an outbound adapter. An inbound adapter is used to send data to a server, and an outbound adapter returns the output.
To enable [Monitoring], click [Configuration] > [Log Configuration], and then set the transaction log level to be TRACE or higher. To monitor all messages sent from an inbound adapter to an outbound adapter, BizTx and inbound endpoint logging levels must be set to TRACE or higher. When this configuration is completed, click [Monitoring] > [Biz System] to view the system logs.
To go to the Transaction screen, click [Monitoring] > [Biz System].
To search transactions, select a server or cluster to monitor from the navigation pane, enter search conditions, and then click [Search]. Transactions with an error are displayed with a different color.
Clicking 'GUID' from the list opens Transaction Trace ([Monitoring] - [Biz System] - Transaction Trace) that displays detailed information about the transaction.
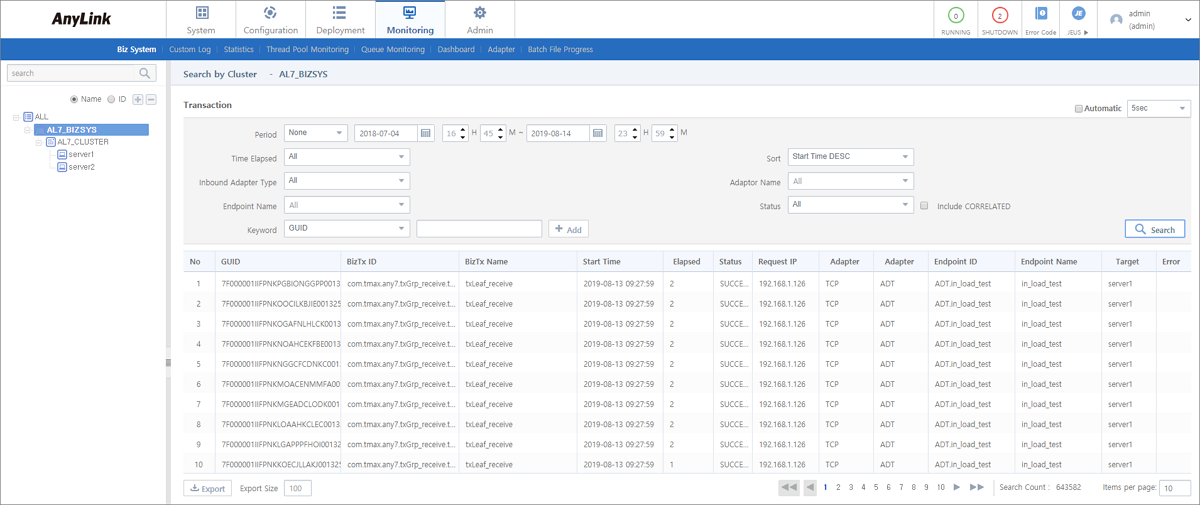
-
Search Conditions
Enter the following search conditions and then click [Search].
Item Description Automatic Search
To automatically search for transactions repeatedly, select the interval and select this checkbox.
Period
Search period. You can select from Last 1 min to Last 1 day. You can also enter the period, or select it by clicking the Calendar icon.
Time Elapsed
Time elapsed to execute a BizTx.
Sort
Message sorting option.
-
Start Time DESC: Sort Strat Time in descending order.
-
Start Time ASC: Sort Strat Time in ascending order.
-
BizTx ID DESC: Sort BizTx ID in descending order.
-
BizTx ID ASC: Sort BizTx ID in ascending order.
-
Elapsed Time DESC: Sort Elapsed in descending order.
-
Elapsed Time ASC: Sort Elapsed in ascending order.
Inbound Adapter Type
Type of the inbound adapter used by transactions to search.
Adaptor Name
Name of the adapter used by transactions to search.
Endpoint Name
Name of the endpoint used by transactions to search.
Status
Message status.
-
SUCCESS
-
FAIL
-
RUNNING
-
ERROR
-
SERVERDOWN
To display CORRELATE status log, select 'Include CORRELATED'. This checkbox is unselected by default.
BizTx Type
BizTx type.
Only available when a config file of AnyLink Studio is set in User Meta Info ([Admin] - [DIS Configuration] - User Meta Info) of DIS Configuration shown by clicking [Admin] > [DIS Configuration].
You can select a BizTx type from the drop-down list saved in the config file. For more information, refer to DIS Configuration.
Keyword
Keyword to search for all matching content.
Select the attribute of a keyword from the dropdown list and then enter the value in the text box.
-
GUID: BizTx IDs.
-
PGUID: BizTx IDs of specified parent BizTx.
-
BizTx Name: All BizTxs with the specified name.
-
BizTx ID: All BizTxs with the specified ID.
-
Request IP: Endpoint IPs.
-
Adapter Name: All BizTxs that used the adapter with the specified name.
-
Endpoint Name: All BizTxs that used the endpoint with the specified name.
-
Endpoint ID: All BizTxs that used the endpoint of the specified ID.
-
-
Transaction List
Item Description GUID
ID of the executed BizTx.
BizTx ID
BizTx ID.
BizTx Type
BizTx type.
Only available when a config file of AnyLink Studio is set in User Meta Info ([Admin] - [DIS Configuration] - User Meta Info) of DIS Configuration shown by clicking [Admin] > [DIS Configuration] and is deployed successfully.
BizTx Name
BizTx name.
Start Time
BizTx start time.
Elapsed
Total time elapsed to execute a BizTx.
Status
BizTx status.
-
SUCCESS: The job is completed successfully.
-
FAIL: It is failed to try to process the job.
-
RUNNING: The job is being processed.
-
ERROR: An error occurred during the job processing.
-
SERVERDOWN: The server is downed.
Request IP
Request IP.
Adapter Type
Adapter type.
Adapter Name
Adapter name.
Endpoint ID
Endpoint ID.
Endpoint Name
Endpoint name.
Target Server Field
Server where the BizTx is processed.
Error
When an error occurs,
 (warning) is displayed. Click the icon to view the details of the error in Check Error.
To check more information about error codes and their resolution, click [Error Code] in the Info Section. This opens the Error Code window.
-
-
Buttons
Button Description [Export]
Exports transaction log as a .csv file.
The default export size is 100, and it can be modified by the user. The export size cannot exceed 100,000 because too much data to download may cause an error.
Transaction Trace
Displays detailed information about a transaction.
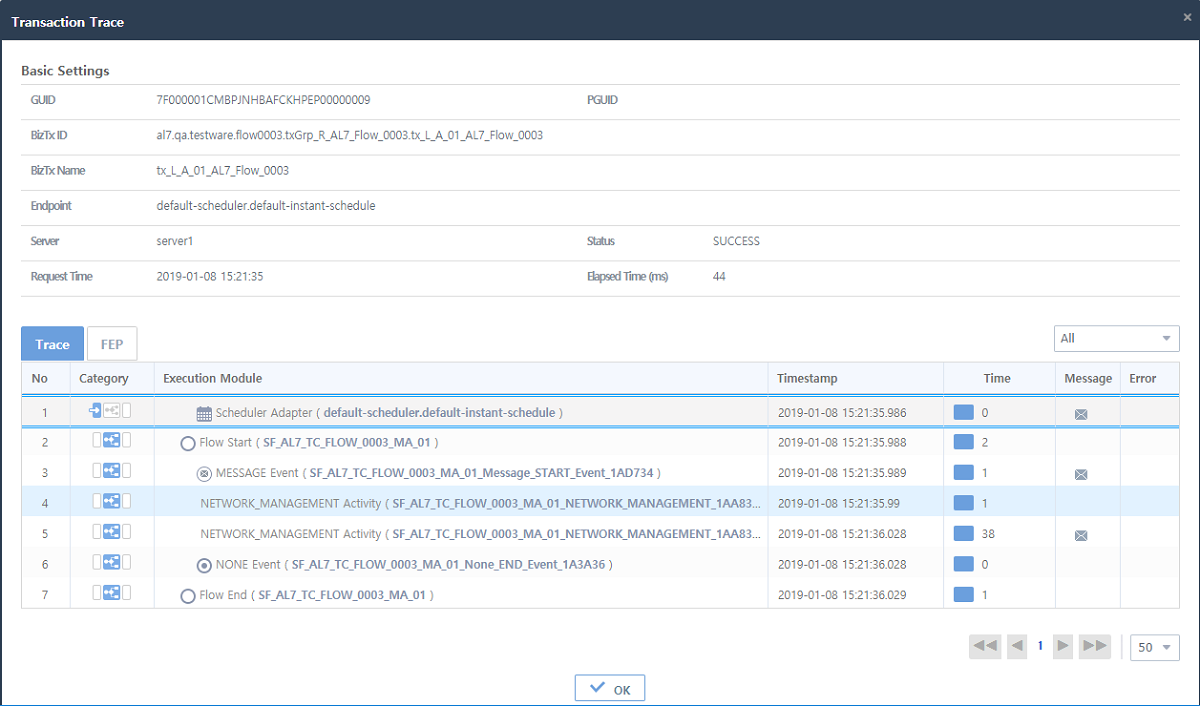
-
Basic Settings
Item Description GUID
ID of the executed BizTx.
PGUID
ID of the parent BizTx of the executed BizTx
BizTx ID
BizTx ID.
BizTx Name
BizTx name.
Endpoint
Inbound endpoint that received a message first.
Server
Name of the server where the BizTx was executed.
Status
BizTx status.
Request Time
BizTx execution time.
Elapsed Time (ms)
Time elapsed to execute a BizTx.
-
[Trace] Tab
Displays transaction flows. You can search for trace log with the search conditions (All, Error, or Communication).
Item Description No
Execution order.
Category
Indicates the location where a BizTx task was performed (Inbound Adapter/Flow/Outbound Adapter) and status of the processed data.
When a BizTx task has been performed, the icon in the category section changes. When the cursor moves over the icon, a message box indicates the performance status. For more information about icons, refer to "Monitoring Icons", and for more information about BizTx tasks, AnyLink Studio Guide.
Execution Module
Type of module used to process a BizTx task. Icons represent the module type, and the module ID is displayed in the parentheses. Optional icons can follow the module ID to indicate the type of the task performed by the module. These icons may not appear depending on the status of the execution module.
Timestamp
Time when a BizTx task was completed.
Time
Time elapsed to execute a BizTx task.
Message
If logging is set to display the message content,
 (message) is displayed. Click the icon to view the details of the message in Check Message ([Monitoring] - [Biz System] - Transaction Trace - [Text View] Tab).
Error
When an error occurs,
 (warning) is displayed. Click the icon to view the details of the error in Check Error.
To check more information about error codes and their resolution, click [Error Code] in the Info Section. This opens the Error Code window.
Clicking
 (message) in the 'Message' column opens the Check Message window where you can check the message contents. To close the window, click [OK]. To retransmit the message, click [Retransmit].The [Retransmit] button is only available for users who have retransmit permission.
Retransmit permission can be set by clicking the following menus. For more information, refer to Permission Management.
-
[Admin] > [Permission Management] > Permissions: Adds and edits permissions such as retransmit permission.
-
[Admin] > [Permission Management] > Roles: Adds retransmit permission to Role ID.
-
[Admin] > [Permission Management] > User Roles: Adds User ID for retransmission to Role.
The following describes each tab in the Check Message window.
-
[Text View] Tab
Displays message contents as text. If the contents are not displayed or broken, change the value in 'Decoding Type'.
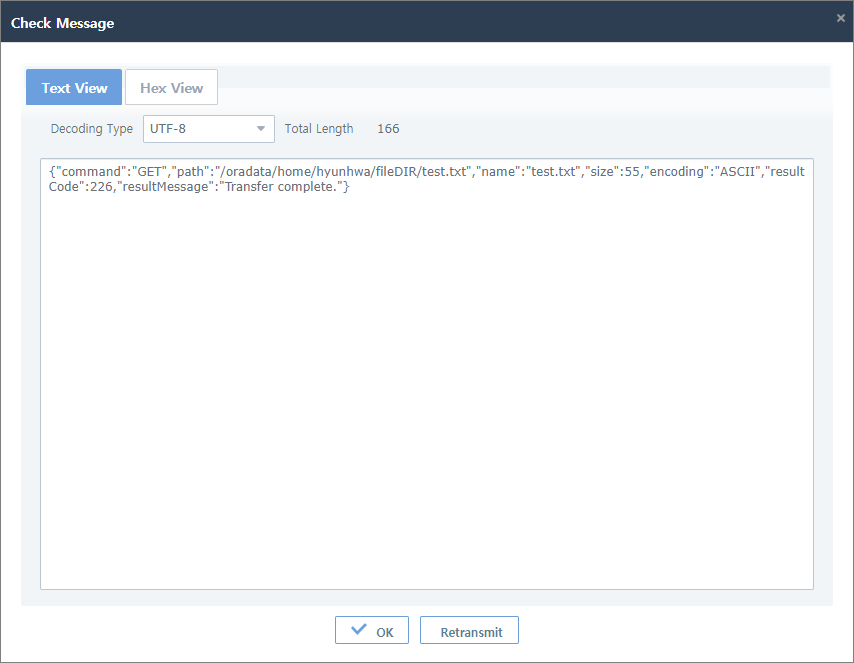 [Monitoring] - [Biz System] - Transaction Trace - [Text View] Tab
 -
[Hex View] Tab
Displays message contents as text and hexadecimal values.
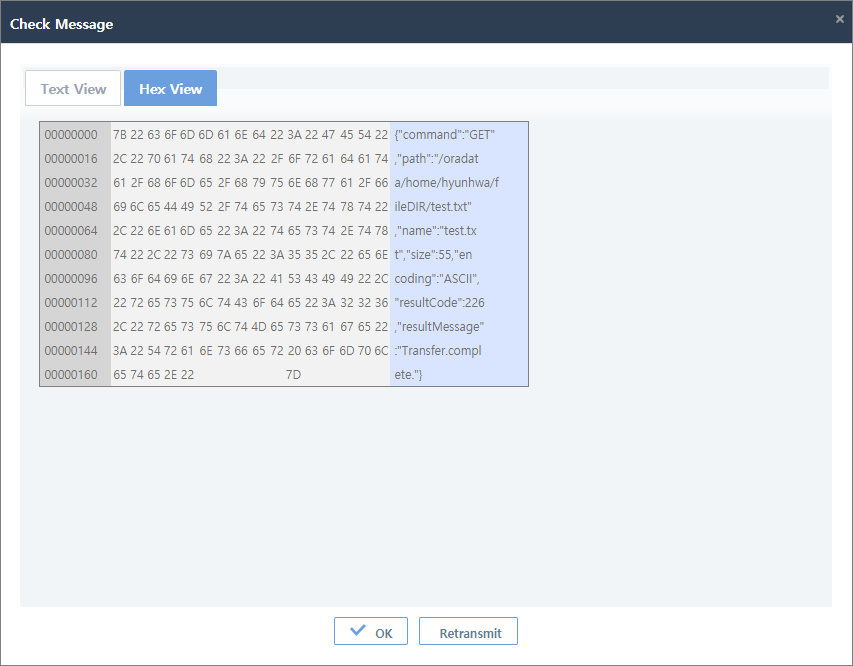 [Monitoring] - [Biz System] - Transaction Trace - [Hex View] Tab
 -
[Before Text View] Tab
Only available when an adapter message handler is used. Displays message contents before the handler as text.
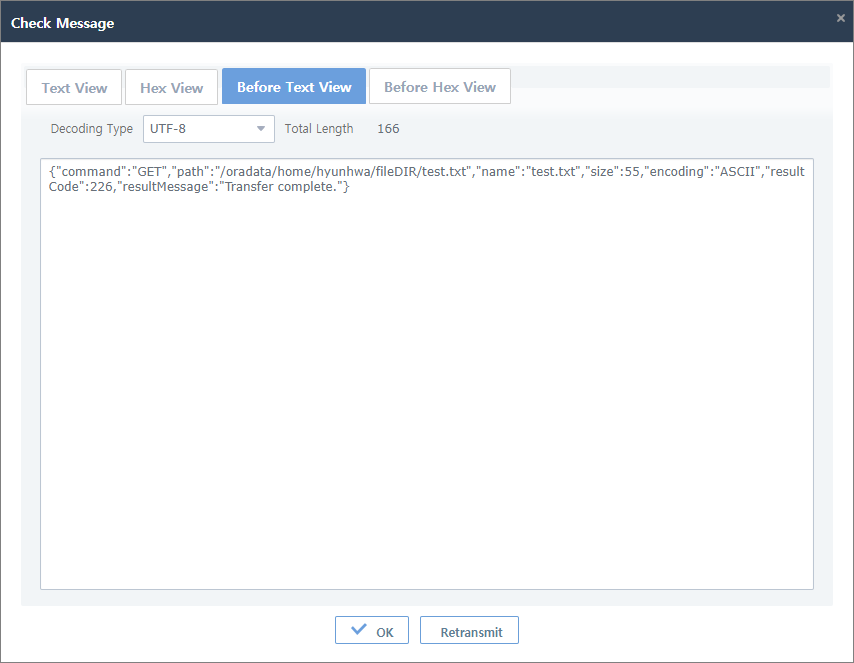 [Monitoring] - [Biz System] - Transaction Trace - [Before Text View] Tab
 -
[Before Hex View] Tab
Only available when an adapter message handler is used. Displays message contents before the handler as text and hexadecimal values.
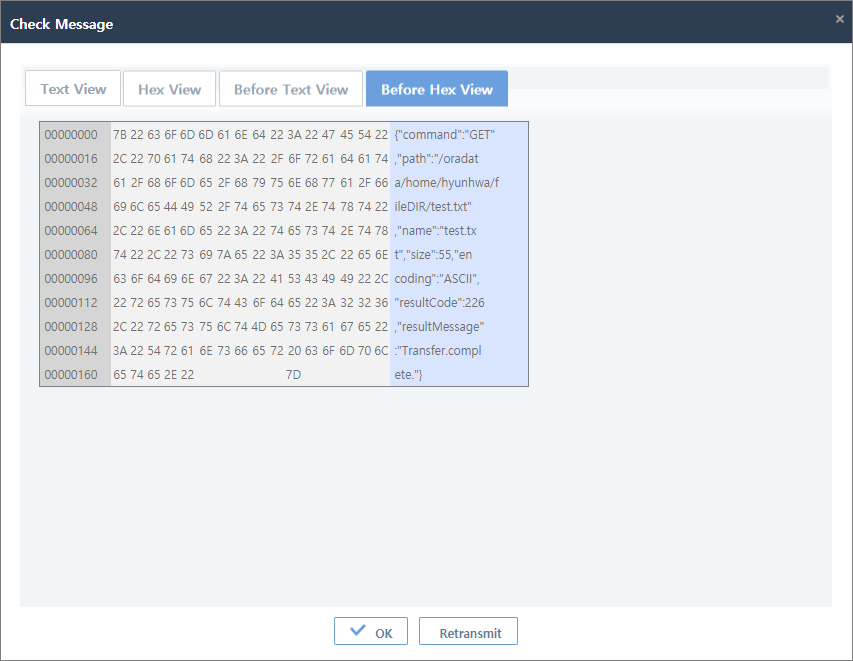 [Monitoring] - [Biz System] - Transaction Trace - [Before Hex View] Tab
-
-
[FEP] Tab
Displays message logs by request and response. Response/request and send/receive are determined based on the time when the message arrives at an endpoint. For the endpoint BizTx type in trace log, AfterCalled, BeforeReply, AfterReplied, and BeforeCall are displayed.
Clicking [Receive request], [Send Request], [Receive response], or [Send response] or clicking [Compare Receive Request/Send Response Messages] or [Compare Send Request/Receive Response Messages] opens the Check FEP Message window ([Monitoring] - [Biz System] - Transaction Trace - [FEP] Tab - Check FEP Message) where you can check request/response messages.
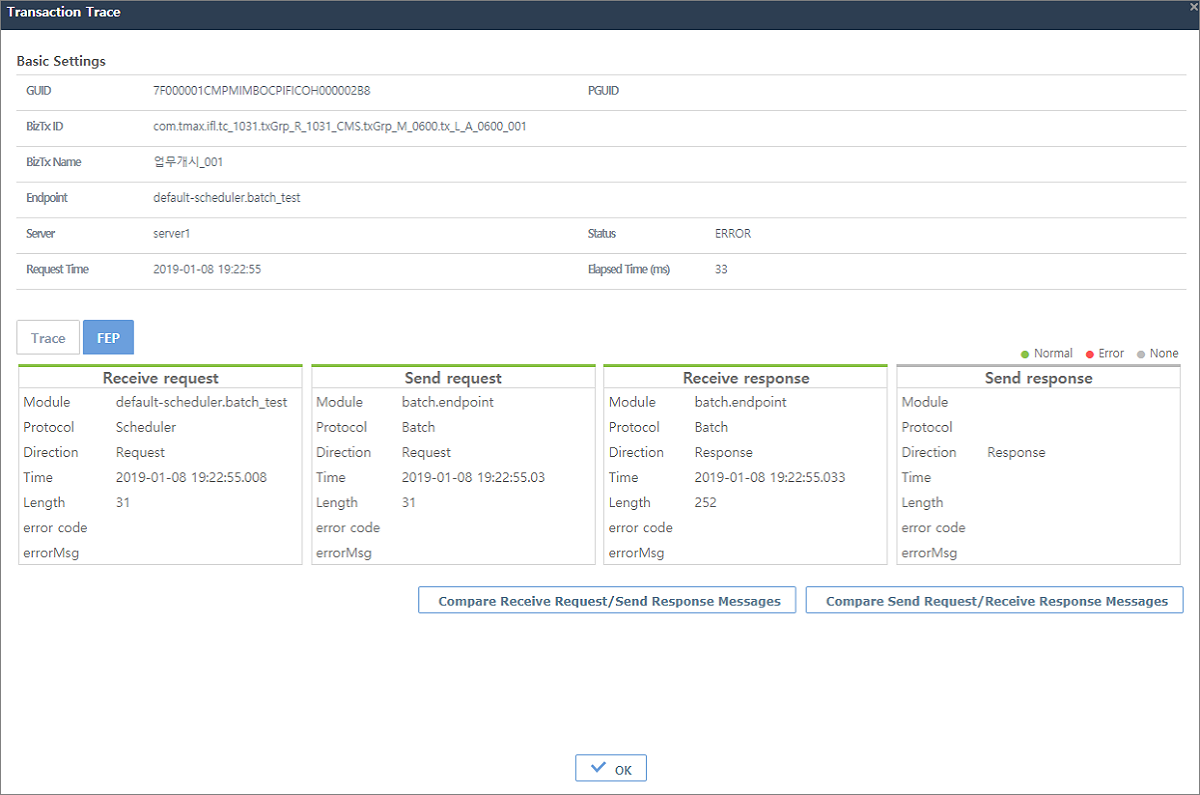 [Monitoring] - [Biz System] - Transaction Trace - [FEP] Tab
-
FTP/FILE Summary
[FTP/FILE Summary] is available for FTP/FILE transactions. Clicking the button opens the FTP/FILE Summary window where you can check files sent or received through a FTP and FILE outbound rule.
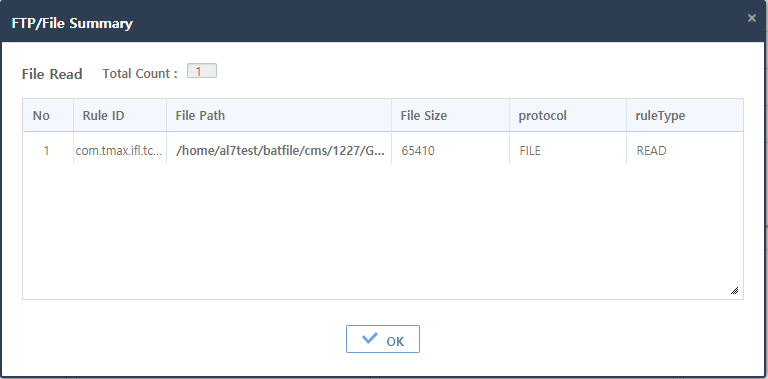 [Monitoring] - [Biz System] - Transaction Trace - [FEP] Tab - FTP/FILE Summary
 -
Compare Receive Request/Send Response Messages, Compare Send Request/Receive Response Messages
Clicking [Compare Receive Request/Send Response Messages] or [Compare Send Request/Receive Response Messages] opens the Check FEP Message window where you can check request/response messages.
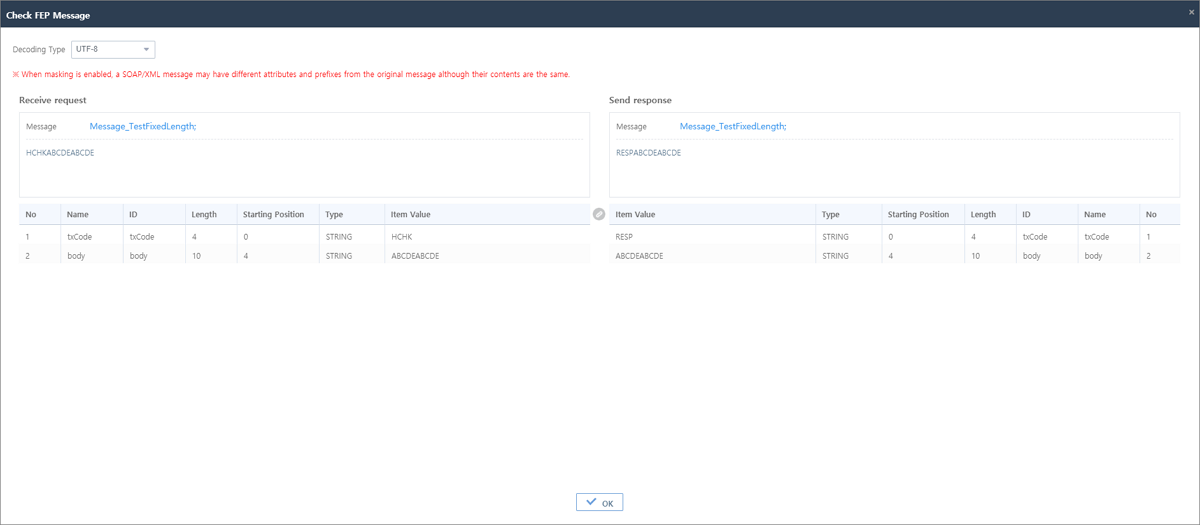 [Monitoring] - [Biz System] - Transaction Trace - [FEP] Tab - Check FEP Message
-
3. Custom Log
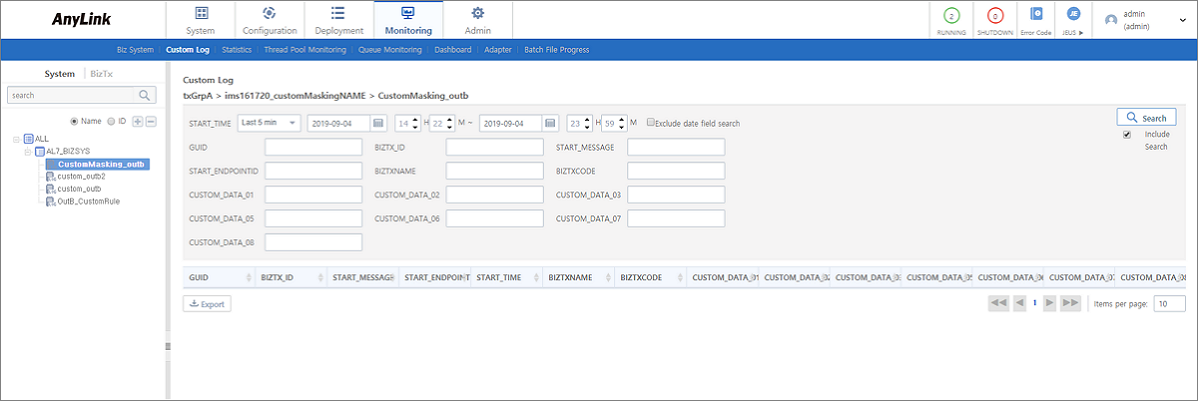
The [Custom Log] menu is used to search for transaction trace log by using message contents. Custom log must be predefined in AnyLink Studio. You can only retrieve the log in WebAdmin. For more information, refer to AnyLink Studio Guide.
To go to the Custom Log screen, click [Monitoring] > [Custom Log]. To search for custom log, select System or BizTx in the navigation pane. This displays custom log set in AnyLink Studio. If the custom log uses GUID, click 'GUID' to check detailed information about the transaction. You can check the information in Transaction Trace ([Monitoring] - [Biz System] - Transaction Trace) that opens.
-
Search Conditions
Enter the following search conditions and then click [Search].
Item Description START_TIME
Search period. You can select from Last 1 min to Last 1 day. You can also enter the period, or select it by clicking the Calendar icon.
Exclude date field search
Option to use a date as a search condition. If custom log data type is 'DATE' or 'TIMESTAMP', a date can be used as a search condition.
This checkbox is unselected by default. If selected, a date is not used as a search condition.
GUID
BizTx ID.
Include Search
Search option. This checkbox is selected by default.
-
If selected, search queries are processed using 'LIKE search', which searches for all data including the search value.
-
If unselected, search queries are processed using 'EQUAL search', which searches for identical data to the search value.
-
-
Buttons
Button Description [Export]
Exports transaction log as a .csv file.
The default export size is 100, and it can be modified by the user. The export size cannot exceed 100,000 because too much data to download may cause an error.
4. Statistics
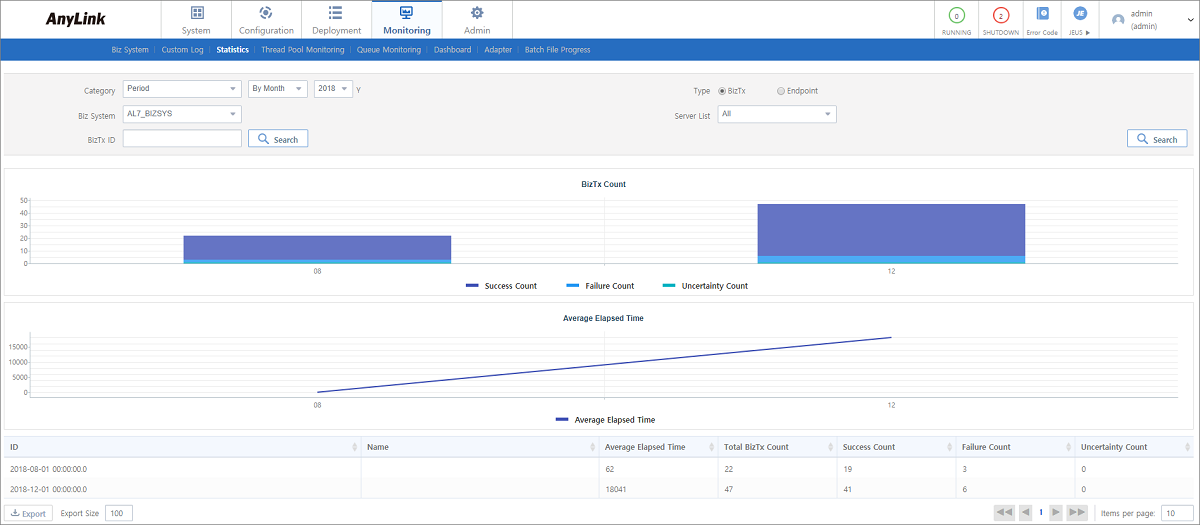
The [Statistics] menu is used to view the information about a BizTx during a specified period of time.
To go to the Statistics screen, click [Monitoring] > [Statistics]. To display statistics graph and results, enter search conditions and then click [Search].
-
Search Conditions
Enter the following search conditions and then click [Search].
Item Description Category
Select one of the following categories.
-
Period: Searches for statistics by month, day, or hour.
-
BizTx: Searches for BizTx statistics by month, day, or hour.
-
Endpoint: Searches for endpoint statistics by month, day, or hour.
-
Server: Searches for server statistics by month, day, or hour.
Select one of the following statistics periods. Statistics are collected at specific time and automatically calculated.
-
By Month: Displays a graph with the x-axis of months. Select a year. Statistics are collected at 02:30.
-
By Day: Displays a graph with the x-axis of days. Select a year and month. Statistics are collected at 01:30.
-
By Hour: Displays a graph with the x-axis of hours. Select a year, month, and day. Statistics are collected at 00:30.
Type
Resource type.
-
BizTx
-
Endpoint
Biz System
Biz System.
Server List
Servers in the Biz System.
BizTx/Endpoint ID
BizTx or endpoint ID.
You can select BizTx or endpoint in the Biz System by clicking [Search].
-
-
Statistics Graph
Displays a graph about success count, failure count, and uncertainty count of BizTx according to the search conditions.
-
Statistics Results
Item Description ID
Statistics ID.
Name
Statistics name.
Average Elapsed Time
Average time spent to process a given BizTx.
Total BizTx Count
Total number of executed BizTxs.
Success Count
Number of successful BizTxs.
Failure Count
Number of failed BizTxs.
Uncertainty Count
Number of BizTxs whose success or failure is unknown.
-
Buttons
Button Description [Export]
Exports transaction log as a .csv file.
The default export size is 100, and it can be modified by the user. The export size cannot exceed 100,000 because too much data to download may cause an error.
5. Thread Pool Monitoring
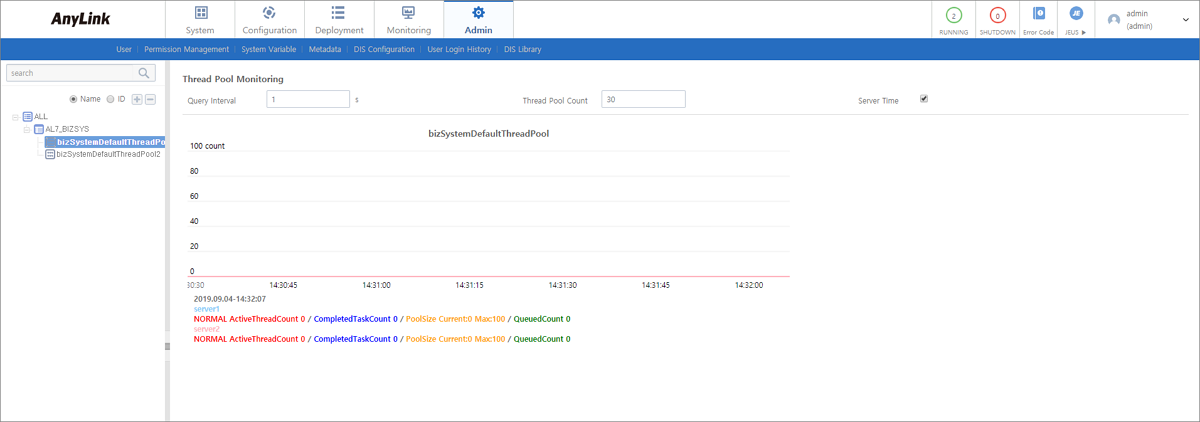
The [Thread Pool Monitoring] menu is used to view thread pool status of use in real time.
To go to the Thread Pool Monitoring screen, click [Monitoring] > [Thread Pool Monitoring]. To display the thread pool status, select a thread pool in the navigation pane and entering monitoring conditions.
-
Monitoring Conditions
Item Description Query Interval
Interval to query thread pools in seconds. Thread pools are monitored each second by default.
Thread Pool Count
Number of maintained thread pools. This does not mean the minimum value. After the first booting, the number of thread pools increases according to BizTx count and is not decreased below this value.
Server Time
Click the checkbox to use the server time displayed on the screen instead of the local PC time.
-
Monitoring Results
Item Description ActiveThreadCount
Number of running active threads. The number is less than or equal to the current pool size.
CompletedTaskCount
Number of completed threads.
This number increases continuously until it reaches the minimum value if the minimum value is large but BizTx count is not large enough.
PoolSize Currrent, Max
-
PoolSize Current: Number of thread pools created currently. At the first booting, a thread pool is not created. The pools are created as actual BizTxs are processed. This number cannot exceed Max. Even after completing BizTx, minimum number of thread pools is maintained.
-
Max: Maximum number of thread pools.
QueuedCount
Number of waiting threads.
-
6. Queue Monitoring
The [Queue Monitoring] menu is used to display messages in a message queue.
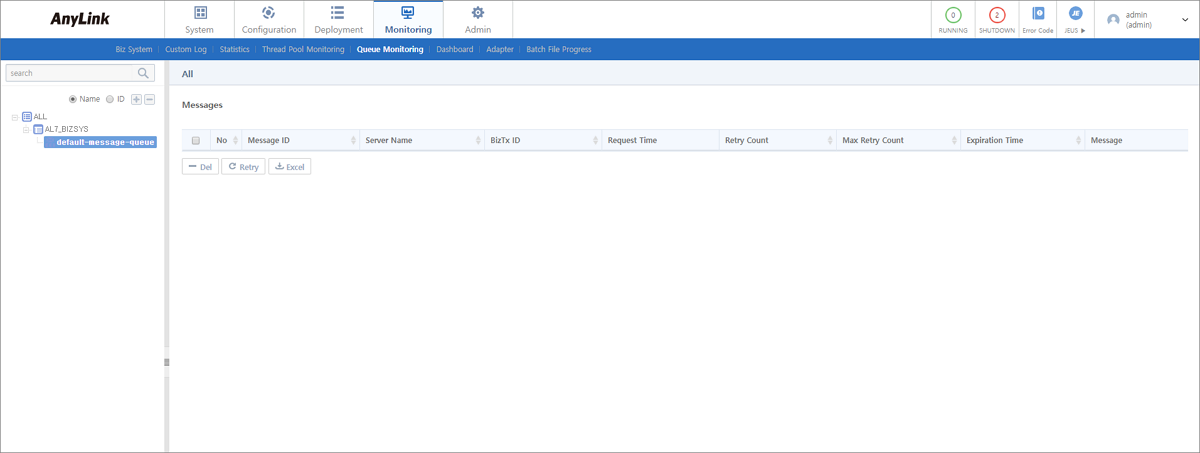
To go to the Queue Monitoring screen, click [Monitoring] > [Queue Monitoring]. To display the message information, select a message queue under a Biz System in the navigation pane.
-
Messages
Item Description Message ID
ID of the message in a message queue.
Server Name
Name of a server that receives the message.
BizTx ID
ID of BizTx for which message delivery guarantee is set.
Request Time
BizTx request time.
Retry Count
BizTx retry count.
Max Retry Count
Maximum automatic retry count.
Expiration Time
Expiration time of the message queue.
Message
Message contents.
-
Buttons
Button Description [Del]
Deletes a selected message.
To delete a message, select the message from the list and then click [Del]. In the confirmation dialog box that opens, click [OK].
A message can be deleted from a database even when the Biz System with the queue is not running.
[Retry]
Manually retries to send a message.
To retry to send a message, select the message from the list and then click [Retry]. The message is sent to the server saved in the table and BizTx is retried.
The retry is available only when the server is running. Manual retry count can exceed Max Retry Count.
[Excel]
Exports the queue message list as a .csv file.
7. Dashboard
The [Dashboard] menu is used to display monitoring information with charts.
To go to the Dashboard screen, click [Monitoring] > [Dashboard]. To display the monitoring information, select Common, BizTx, or Endpoint in the navigation pane and then select an item.
|
To display monitoring information for a Biz System, the data source must be set in Data Source Setting shown by clicking [Configuration] > [Biz System Configuration]. |
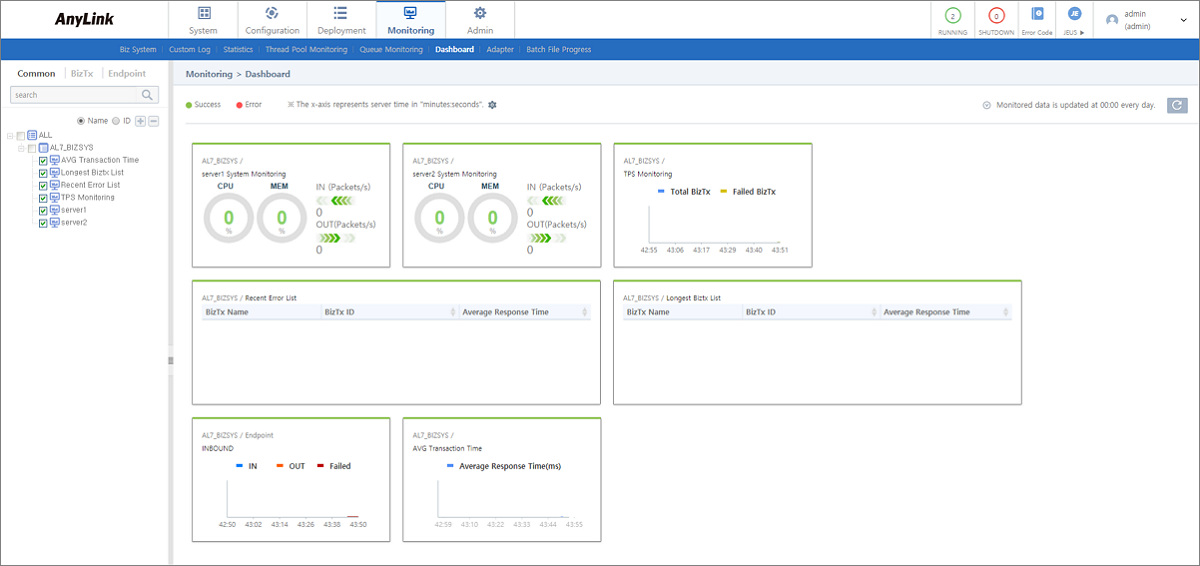
The Dashboard screen shows the following various charts.
-
Charts
The following describes each chart in the Dashboard screen. Charts can be relocated through drag-and-drop.
Item Description AVG Transaction Time
Shows average response time calculated based on statistics ID to refer to.
Longest Biztx List
Shows BizTxs from BizTx with the longest response time to BizTx with the shortest response time in order.
Recent Error List
Shows information about BizTxs with an error.
TPS Monitoring
Shows BizTx processing performance with the total number of BizTxs and the number of failed BizTxs.
Server Monitoring
Shows CPU and memory usages.
If -Dsystem.mornitoring, the server’s jvm option, is set to false, system monitoring is disabled.
To add an item, select the item in the navigation pane. The following chart options are available.
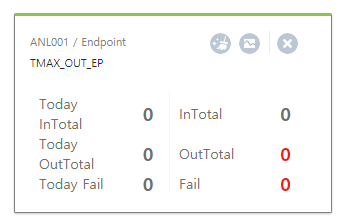 [Monitoring] - [Dashboard] - Chart Options
Icon Description 
Initializes a resource with an error. The error is no long recognized as an error. If a resource has no errors, its chart border color is green. If the resource has an error, the color is red.

Resource data display method (graph or text data).
Initially, a graph is displayed. The display methods are toggled whenever this icon is clicked.

Deletes the chart. Unselecting an item in the navigation pane also deletes a chart.
8. Adapter
The [Adapter] menu is used to display adapter status for each Biz System.
To go to the Adapter Monitoring screen, click [Monitoring] > [Adapter].
|
To display monitoring information for a Biz System, the data source must be set in Data Source Setting shown by clicking [Configuration] > [Biz System Configuration]. |
You can select adapter status (RUNNING, ERROR, and STOPPED) and either Biz System or Protocol at the top right.

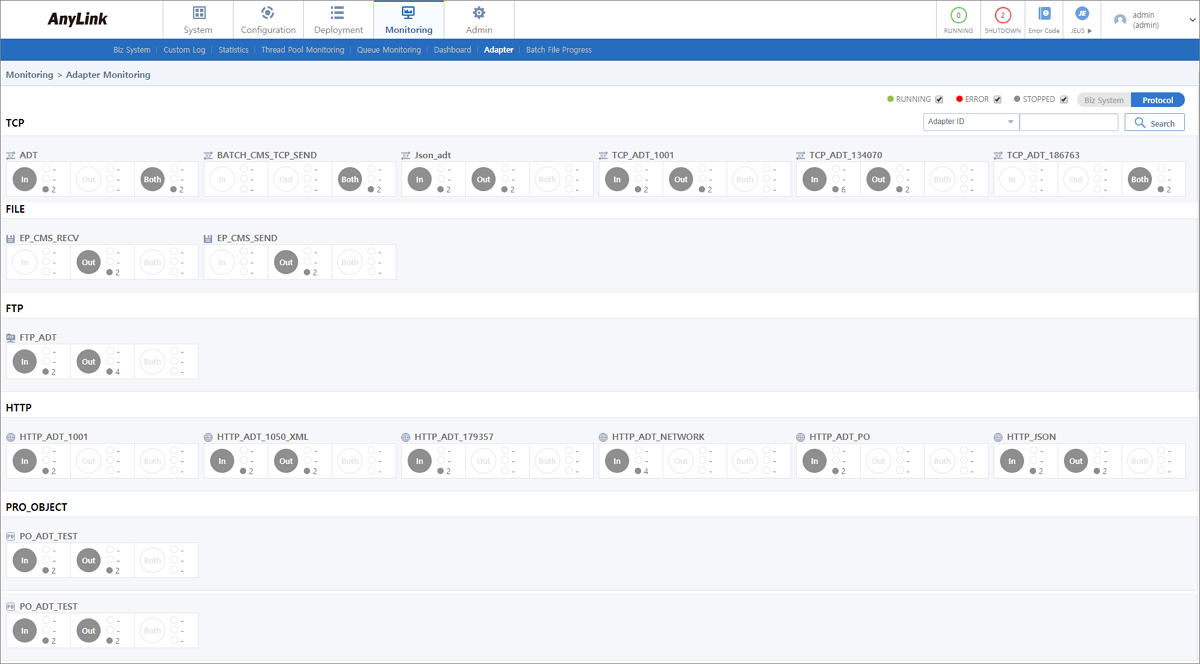
-
Charts
The following is a chart for each endpoint. Hovering the mouse over an adapter name shows Adapter Name, Adapter ID, and Biz System Name in a tooltip.
 [Monitoring] - [Adapter] - Endpoints
Item Description Data Expression
A big circle at the left expresses the adapter status as follows:
-
Red: There are one or more errors.
-
Green: There are one or more running endpoints (no error).
-
Gray: There are one or more stopped endpoints (no error).
-
White: There is no endpoint.
Small circles at the right express the number of endpoints. The number at the right of the green circle means that of running endpoints. The number at the right of the red circle means that of endpoints with an error. The number at the right of the gray circle means that of stopped endpoints.
Clicking each status opens the following Endpoint Details ([Monitoring] - [Adapter] - Endpoint Details) window. Note that Connection/Max Session Count is displayed only for TCP adapters. If there is no endpoint, the alarm that says "There is no data." is displayed.
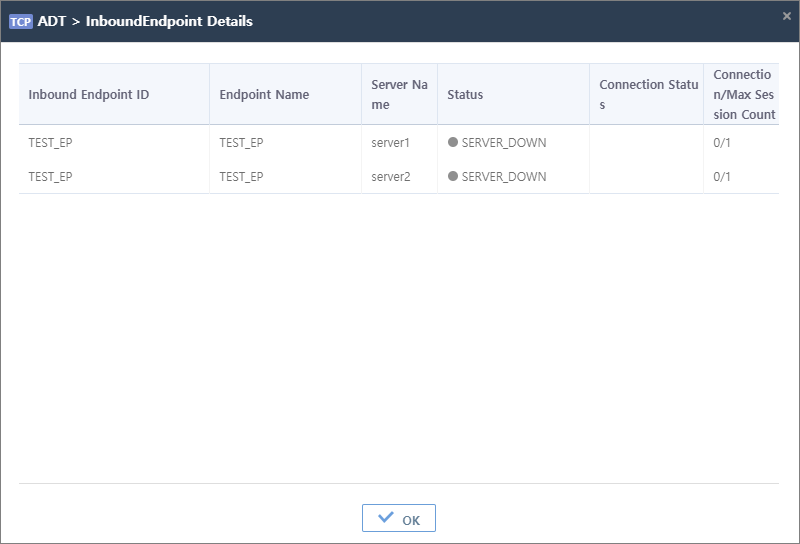 [Monitoring] - [Adapter] - Endpoint Details
 -
9. Batch File Progress
The [Batch File Progress] menu is used to check batch progress. To use this menu, 'Show Batch Progress' must be set to true for each style’s batch rule in AnyLink Studio. For more information, refer to AnyLink Studio Guide.
To go to the Batch File Progress screen, click [Monitoring] > [Batch File Progress]. To display batch progress, enter search conditions and then click [Search].

-
Search Conditions
Enter the following search conditions and then click [Search].
Item Description Period
Period for which batch BizTxs are checked. Enter the period, or select it by clicking the Calendar icon.
Status
Batch progress status.
Organization Code
Organization code where a batch BizTx is processed.
Organization Name
Organization name where a batch BizTx is processed.
File Code
Batch file code.
File Path
Path to batch file.
GUID
batch BizTx ID.
Biz System Name
Biz System name.
Biz Code
Biz code of a batch BizTx.
Response Code
Response code of a batch BizTx.
File Name
Batch file name.
VAN ID
Available when a batch file uses a VAN ID.
Send/Receive
One of All, Send, Receive, and Receive Ready.
-
Batch List
Item Description GUID
Batch BizTx ID.
Biz System Name
Name of the Biz System where the batch BizTx is processed.
Start Time
Time when the batch BizTx starts.
End Time
Time when the batch BizTx ends.
Send/Receive
Batch BizTx status.
-
All
-
Send
-
Receive
-
Receive Ready
Organization Code
Organization code set in the batch rule for the batch BizTx.
Organization Name
Organization name set in the batch rule for the batch BizTx.
Biz Code
Biz code set in the batch rule for the batch BizTx.
File Code
File code set in the batch rule for the batch BizTx.
Status
Batch BizTx processing status.
-
RUNNING
-
FINISHED
-
FAILED
-
SERVERDOWN
Response Code
Response code of the batch BizTx.
Start Status
Start status set in batch flow.
-
Internal: The batch BizTx starts internally.
-
External: The batch BizTx starts externally.
Transaction Date
Transaction date of the batch BizTx.
Batch File Count
Batch file order.
Record Count
Number of processed records compared to the total number of records.
Progress (%)
Batch BizTx progress.
-
If the batch status is in RUNNING, it displays the total progress rate. For example, if Batch File Count is 3/4 and Record Count is 1/2, 87.5% (75% + 12.5%) is displayed.
-
If the batch status is FINISHED, it displays 100%.
-
If the batch status is FAILED, it displays Record Count regardless of Batch File Count.
File Path
Path to the batch file.
File Name
Batch file name.
VAN ID
VAN ID set in the batch rule for the batch BizTx.
Retransmit
To retransmit a failed batch BizTx, click [Retransmit]. It is available only when the Send/Receive item is Send or Receive Ready. If the value is Recieve or none, the button does not work.
-


